Review device logs
Last updated June 17th, 2026
The Device logs page shows device actions, requested actions, and diagnostics logs for devices in your fleet.
Device actions log
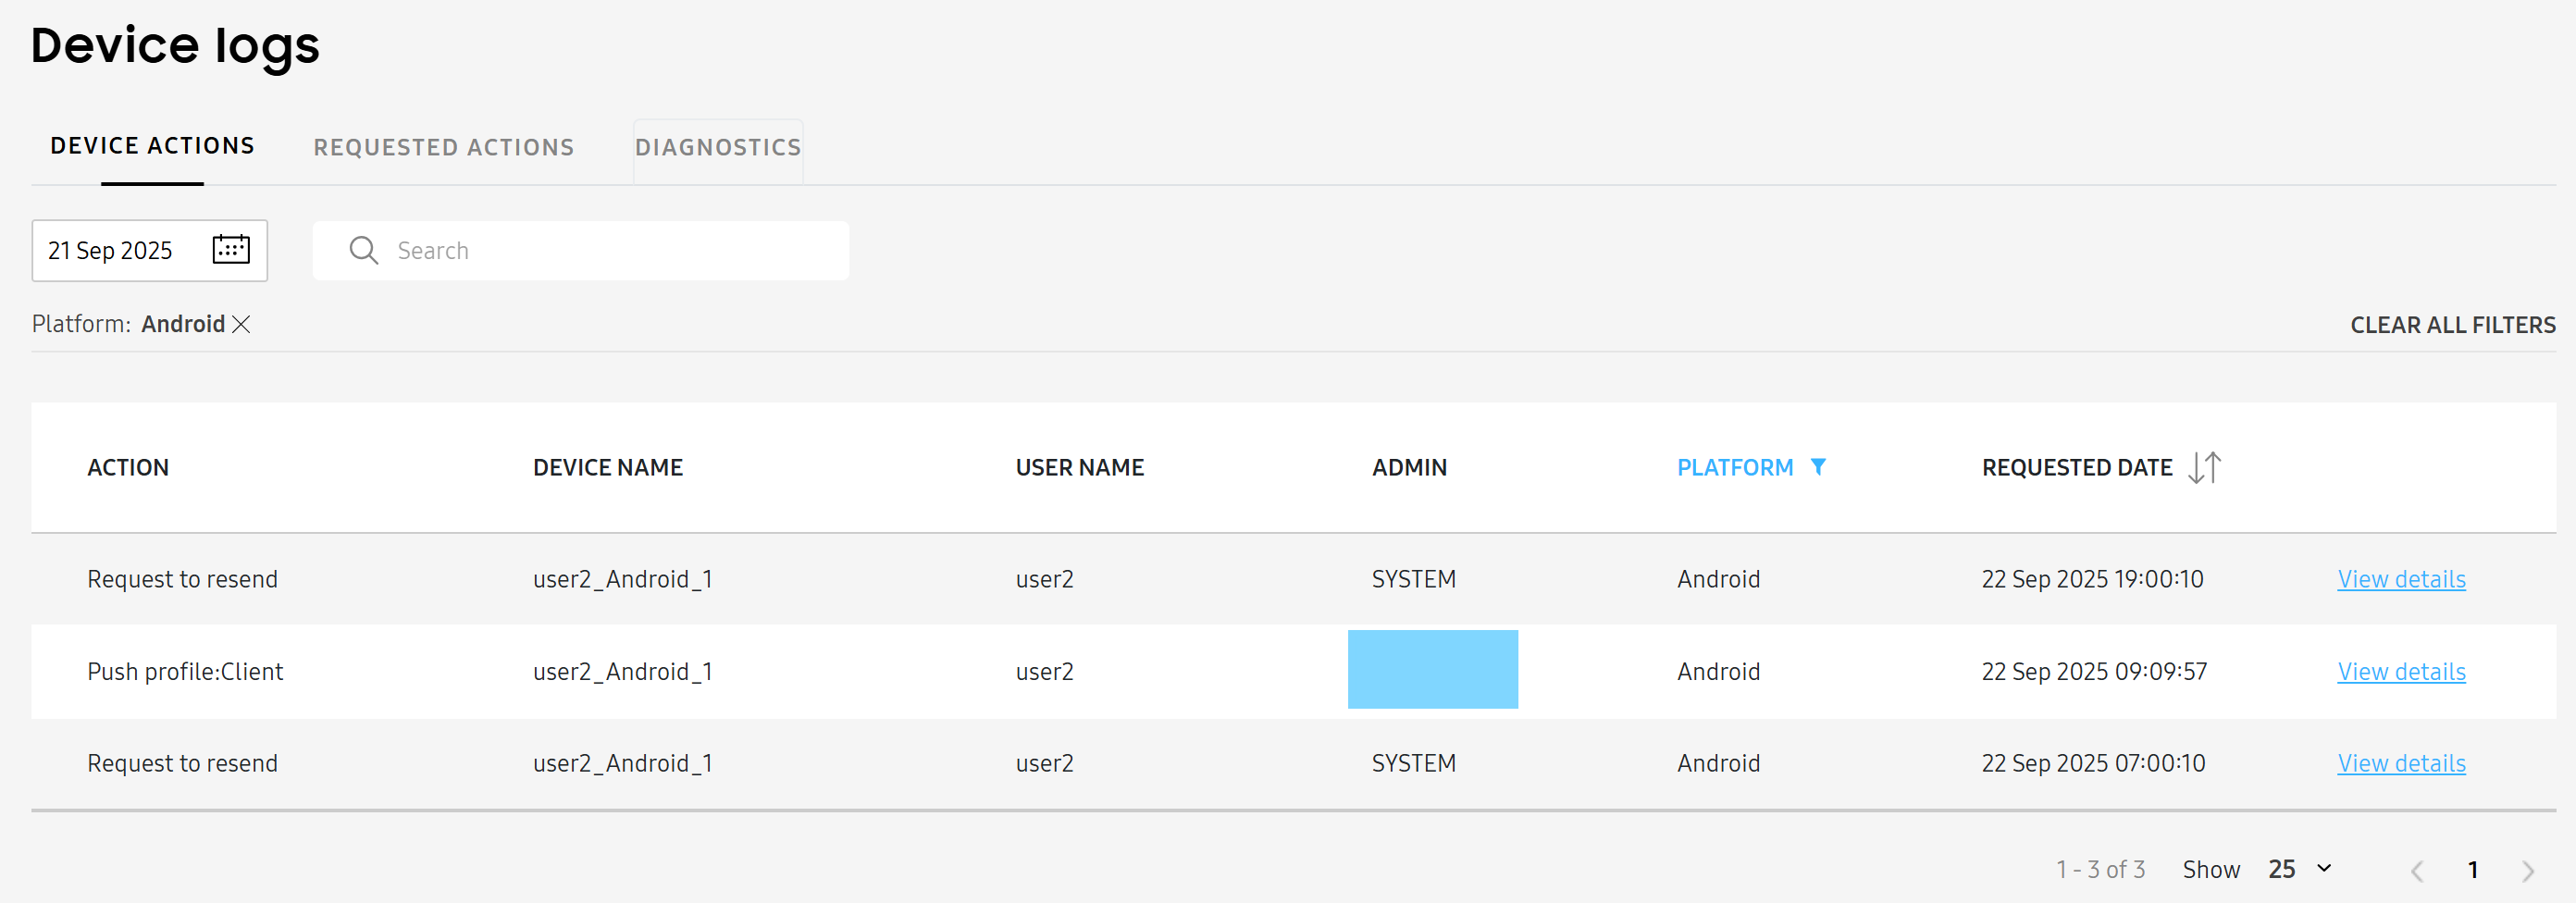
The DEVICE ACTIONS tab displays logged entries for all device actions.
By default, only logs from device actions performed on the current day are displayed, but you can view logs from up to 93 days prior.
The log table is organized into the following columns:
- ACTION — The action performed.
- DEVICE NAME — The name of the device.
- USER NAME — The user name of the individual associated with the device.
- ADMIN — The admin who performed the action.
- PLATFORM — The device’s platform.
- REQUESTED DATE — The date that the admin performed the action.
Log details
To view details about a log event, click View details. The Log details page opens, showing additional details such as the severity level and process information.
If you want to view additional troubleshooting information for an individual device action, click View details on it. The Log details page opens.
At the top of the page, you’ll see some of the same information from the device log, such as the associated device and admin, as well as two fields that can help with troubleshooting:
- Requested ID: A unique key that can be sent to the technical support team.
- Process info and log date: Opens a pop-up with additional process and log data.
If an event is complex, involving communication across the console, server, or devices, then the chain of communication is listed as additional log events. For example, if you send a device command, then the console must communicate with server, which must then communicate with the device — and all those steps will appear as logs.
Click View details on each event to see additional troubleshooting information.

To view the device actions log for a single device, go to the Devices page and select a device. Then click ACTIONS > View device log. The page automatically opens on the DEVICE ACTIONS tab.
Requested actions log
The REQUESTED ACTIONS tab displays all pending device actions. This allows you to view any requests that may have been unsuccessful so that you can request the action again.
By default, only logs from the current day are displayed, but you can view logs from up to 93 days prior.
The log table is organized into the following columns:
- ACTION — The action requested.
- DEVICE NAME — The name of the device.
- USER NAME — The user name of the individual associated with the device.
- PLATFORM — The device’s platform.
- REQUESTED DATE — The date that the admin performed the action.
Device diagnostics log
The DIAGNOSTICS tab displays diagnostic log entries, such as for bug reports that were generated.
To collect the diagnostics log for a given device:
- Navigate to the Devices page and select a device.
- From the ACTIONS drop-down menu, select Perform action on device.
- On the Perform action on device pop-up, click DIAGNOSTICS > Collect device diagnostics log.
Alternatively, to collect device diagnostics for all devices associated with a group, go to the Groups page and select a group, then click ACTIONS > Perform action on device > DIAGNOSTICS > Collect device diagnostics log..
By default, only logs from the past month are displayed. To view logs from other days, edit the date range beside the search bar. You can view logs from up to 93 days prior.
The log table is organized into the following columns:
- DEVICE NAME — The name of the device.
- USER NAME — The user name of the user associated with the device.
- PLATFORM — The device’s platform.
- LAST COLLECTED — The last date and time that an admin collected diagnostics for the device.
To learn more details about a log event, click View details.
On the Log details page that opens, you can delete or download logs. Select a log file, then click ACTIONS > Download Log File or Delete log file. When you download a log, a .txt file downloads to the device’s default download location.
To view the diagnostics log for a single device, go to the Devices page and select a device. Then click ACTIONS > View device log > DIAGNOSTICS.
On this page
Is this page helpful?