Review activity logs
Last updated June 17th, 2026
The Activity logs page features several types of logs which display the history of various actions performed on the Knox Manage console.
Activity log
The ACTIVITY tab provides a history of actions performed on the Knox Manage console across all admins. This includes events such as signing in to the console, adding new users, sending device commands, and viewing specific pages. In tenants with multiple admins, logs can help identify console issues caused by a particular admin’s actions. Activity logs are comparable to audit logs in the original console.
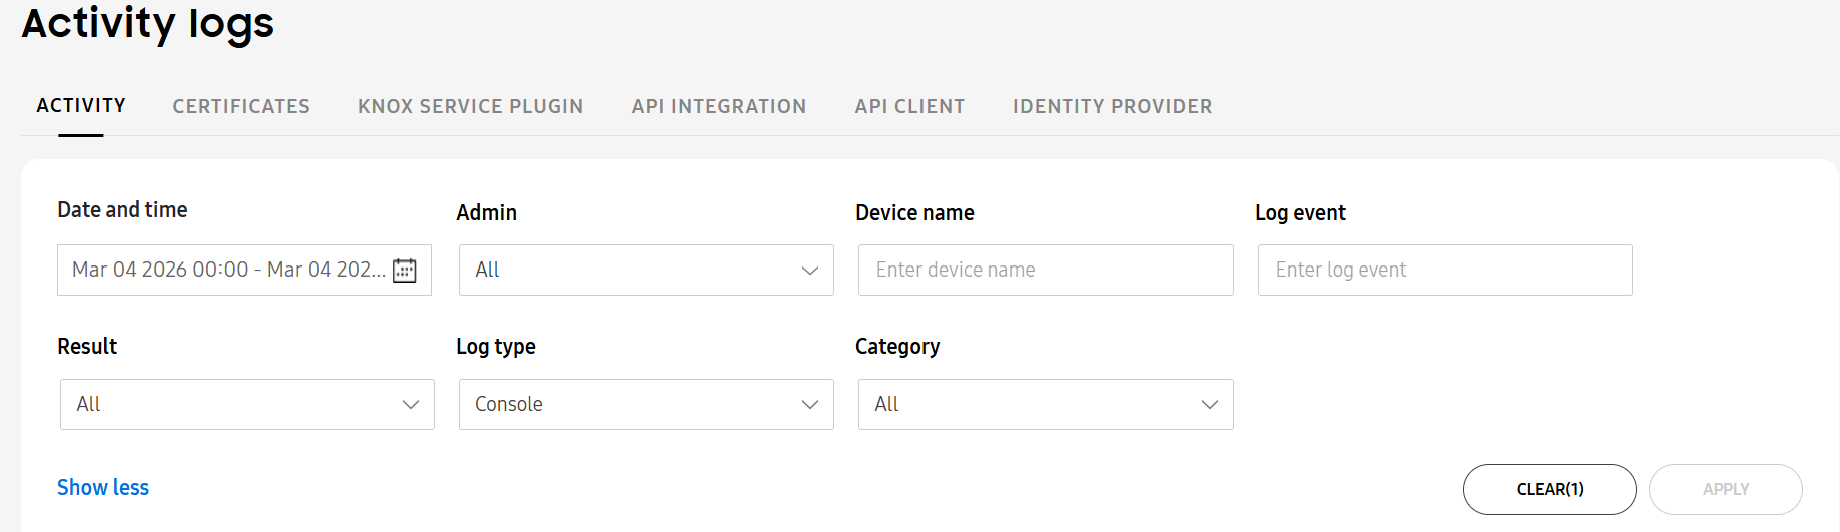
By default, only logs from actions performed on the current day are displayed. To view logs from other days, edit the filter fields at the top of the page. Filters let you customize what logs display on the activity log table. From the tile at the top of the page, you can apply the filters below to sort what logs display on the table. Click Show more to see all available filters.
- Date and time — Specify a date and time range when the action was performed. By default, the current day is selected, but you can view logs from up to 93 days prior.
- Admin — Specify an admin to see only actions performed by them. By default, All is selected.
- Device name — Enter a device name to see the actions performed on it.
- Log event — Specify the description of the action that was performed, such as View device information or Update app feedback.
- Result — Specify the result of the action, specifying whether it succeeded or failed. By default, All is selected.
- Log type — Specify the location impacted by the action, either the Console, Device, or Server. By default, Console is selected.
- Category — Specify the category associated with the action, such as Alert or Enrollment. Select a category from the drop-down list. By default, All is selected.
The columns in the activity log table correspond to the above filters, allowing you to sort logs directly from the table.
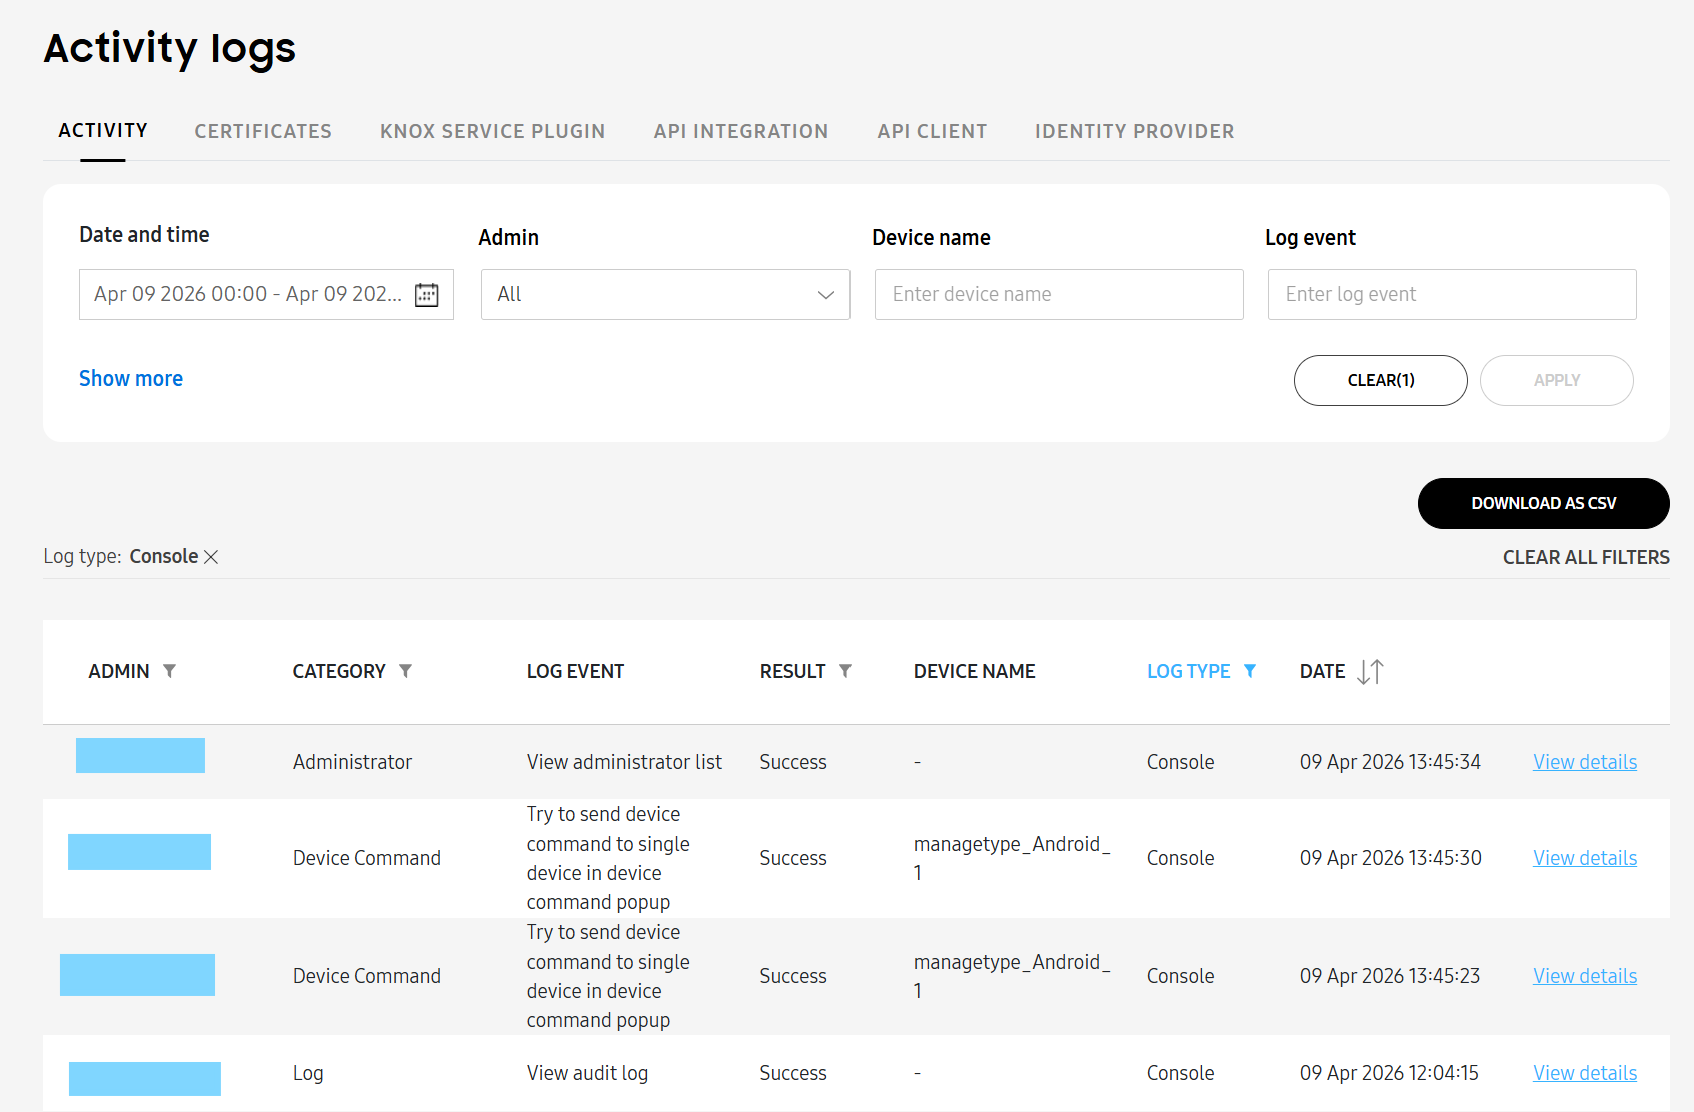
Once the table is filtered to the logs you want to view, you can download the data as a CSV file. To download the logs:
- Click DOWNLOAD AS CSV.
- On the Download as CSV dialog that opens, you may select additional troubleshooting information to download:
- Include additional process information (Request history, Result code, Result history)
- Include additional log data
- Click DOWNLOAD.
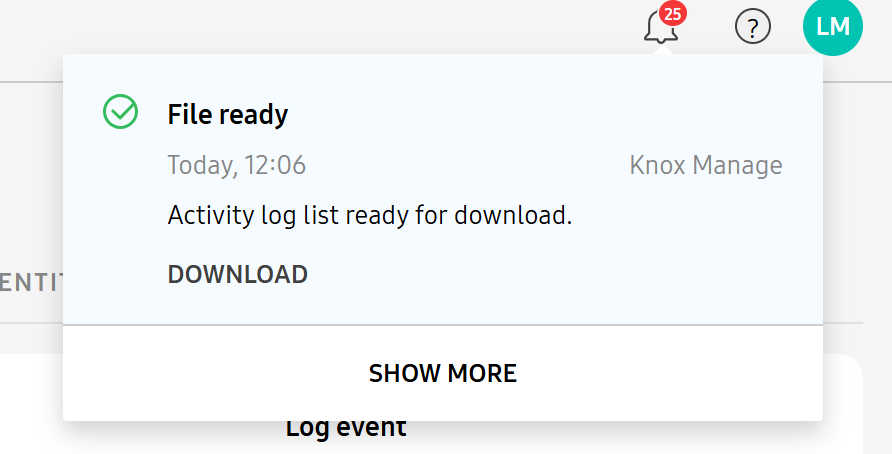
Once the download is ready, it appears in your notifications on the top right of the Knox Admin Portal. Click DOWNLOAD on the notification. A ZIP file containing the logs downloads to your device.
Log details
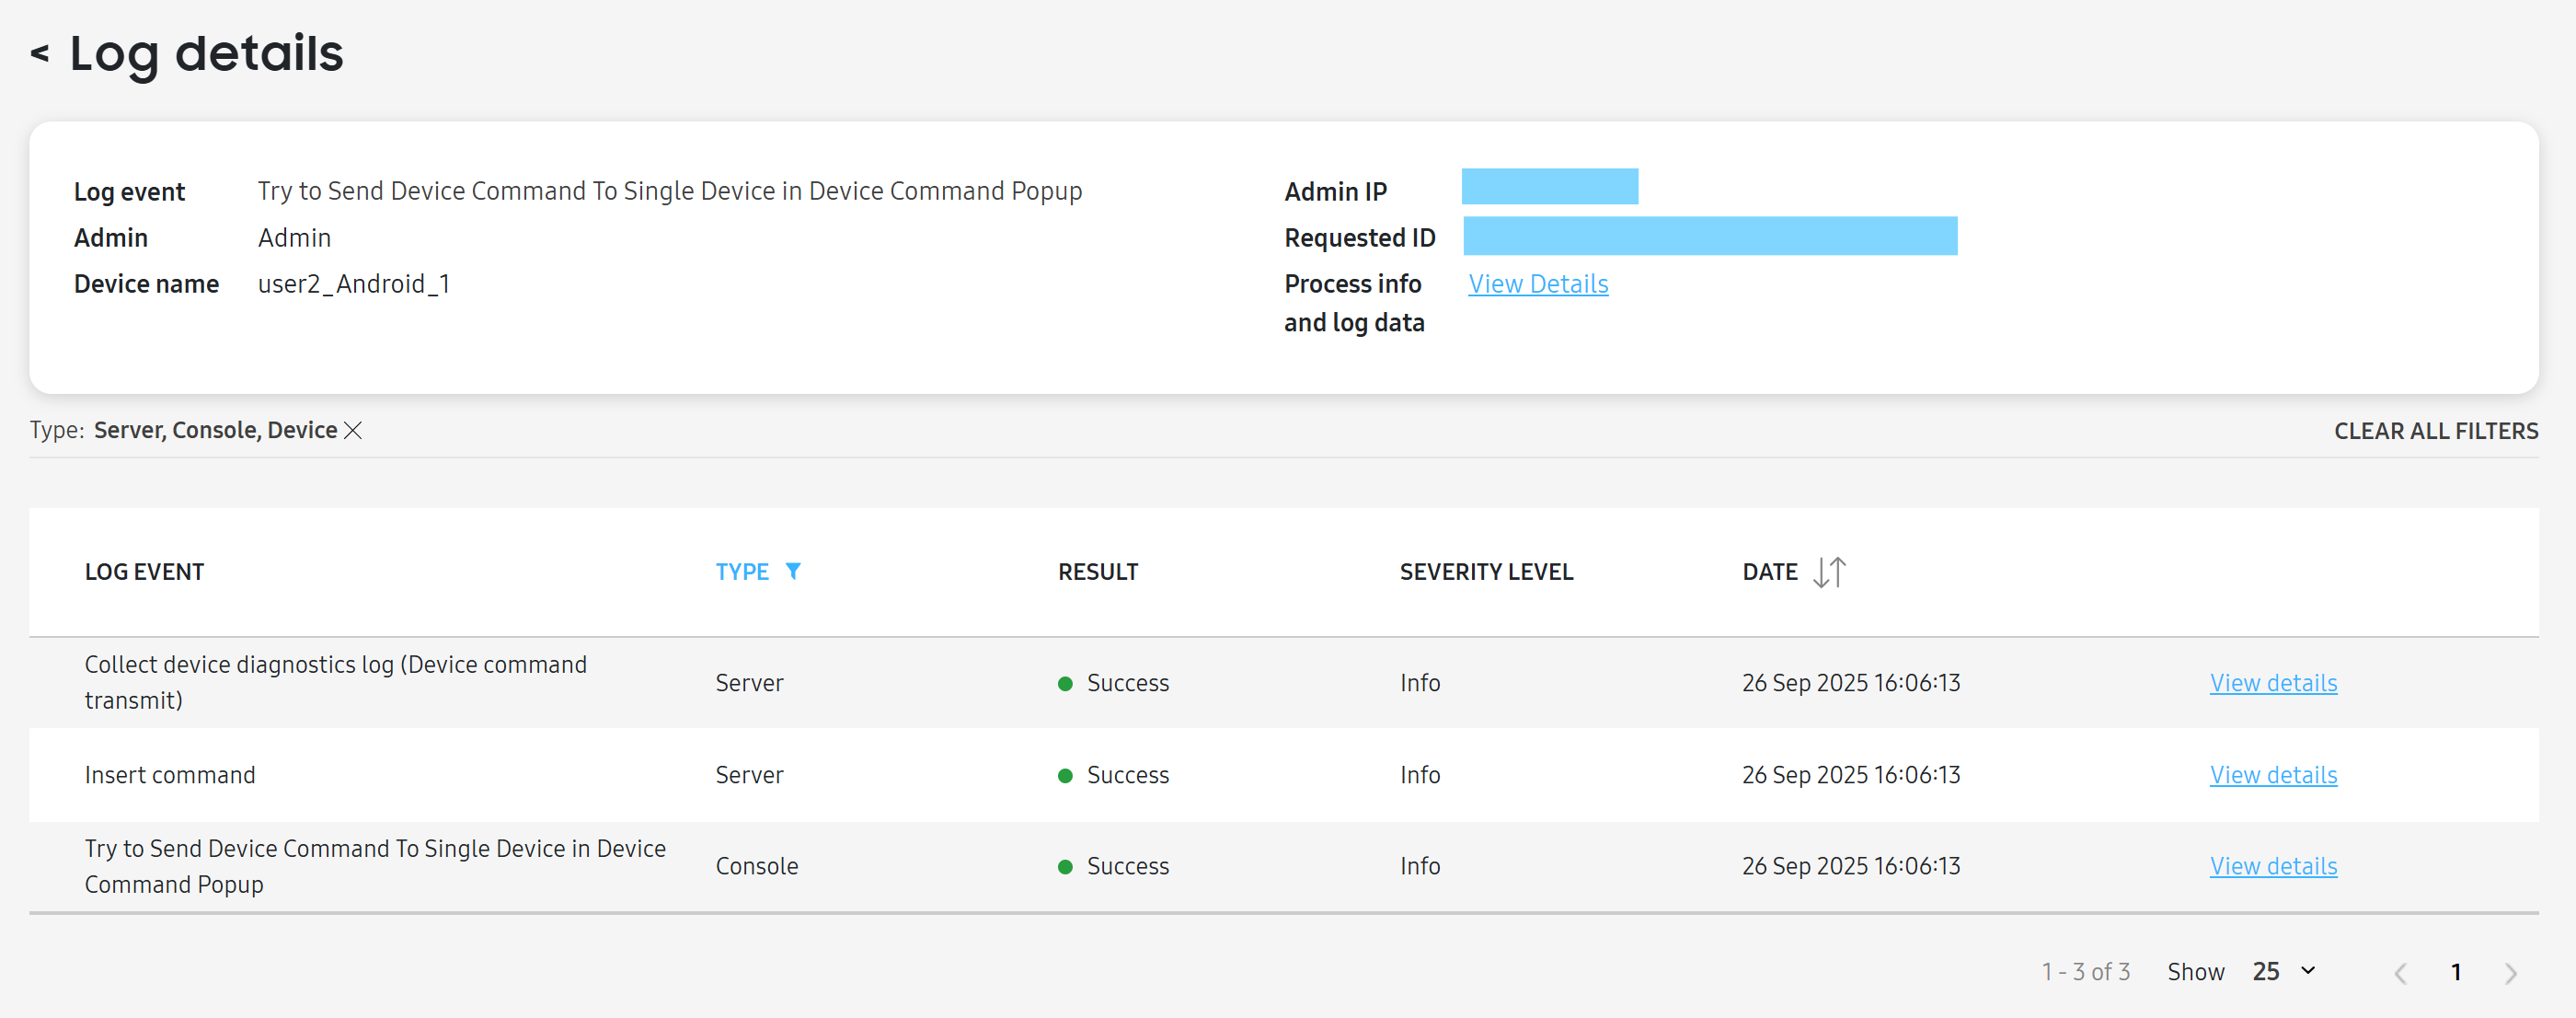
If you want to view additional troubleshooting information for an individual log entry, click View details for it. The Log details page opens.
At the top of the page, you’ll see some of the same information from the activity log, such as the associated admin and device, as well as two fields that can help with troubleshooting:
- Requested ID: A unique key that can be sent to the technical support team.
- Process info and log date: Opens a pop-up with additional process and log data.
If an event is complex, involving communication across the console, server, or devices, then the chain of communication is listed as additional log events. For example, if you send a device command, then the console must communicate with server, which must then communicate with the device — and all those steps will appear as logs.
A list of those events displays. You can click View details on each event to see specific troubleshooting information for it.
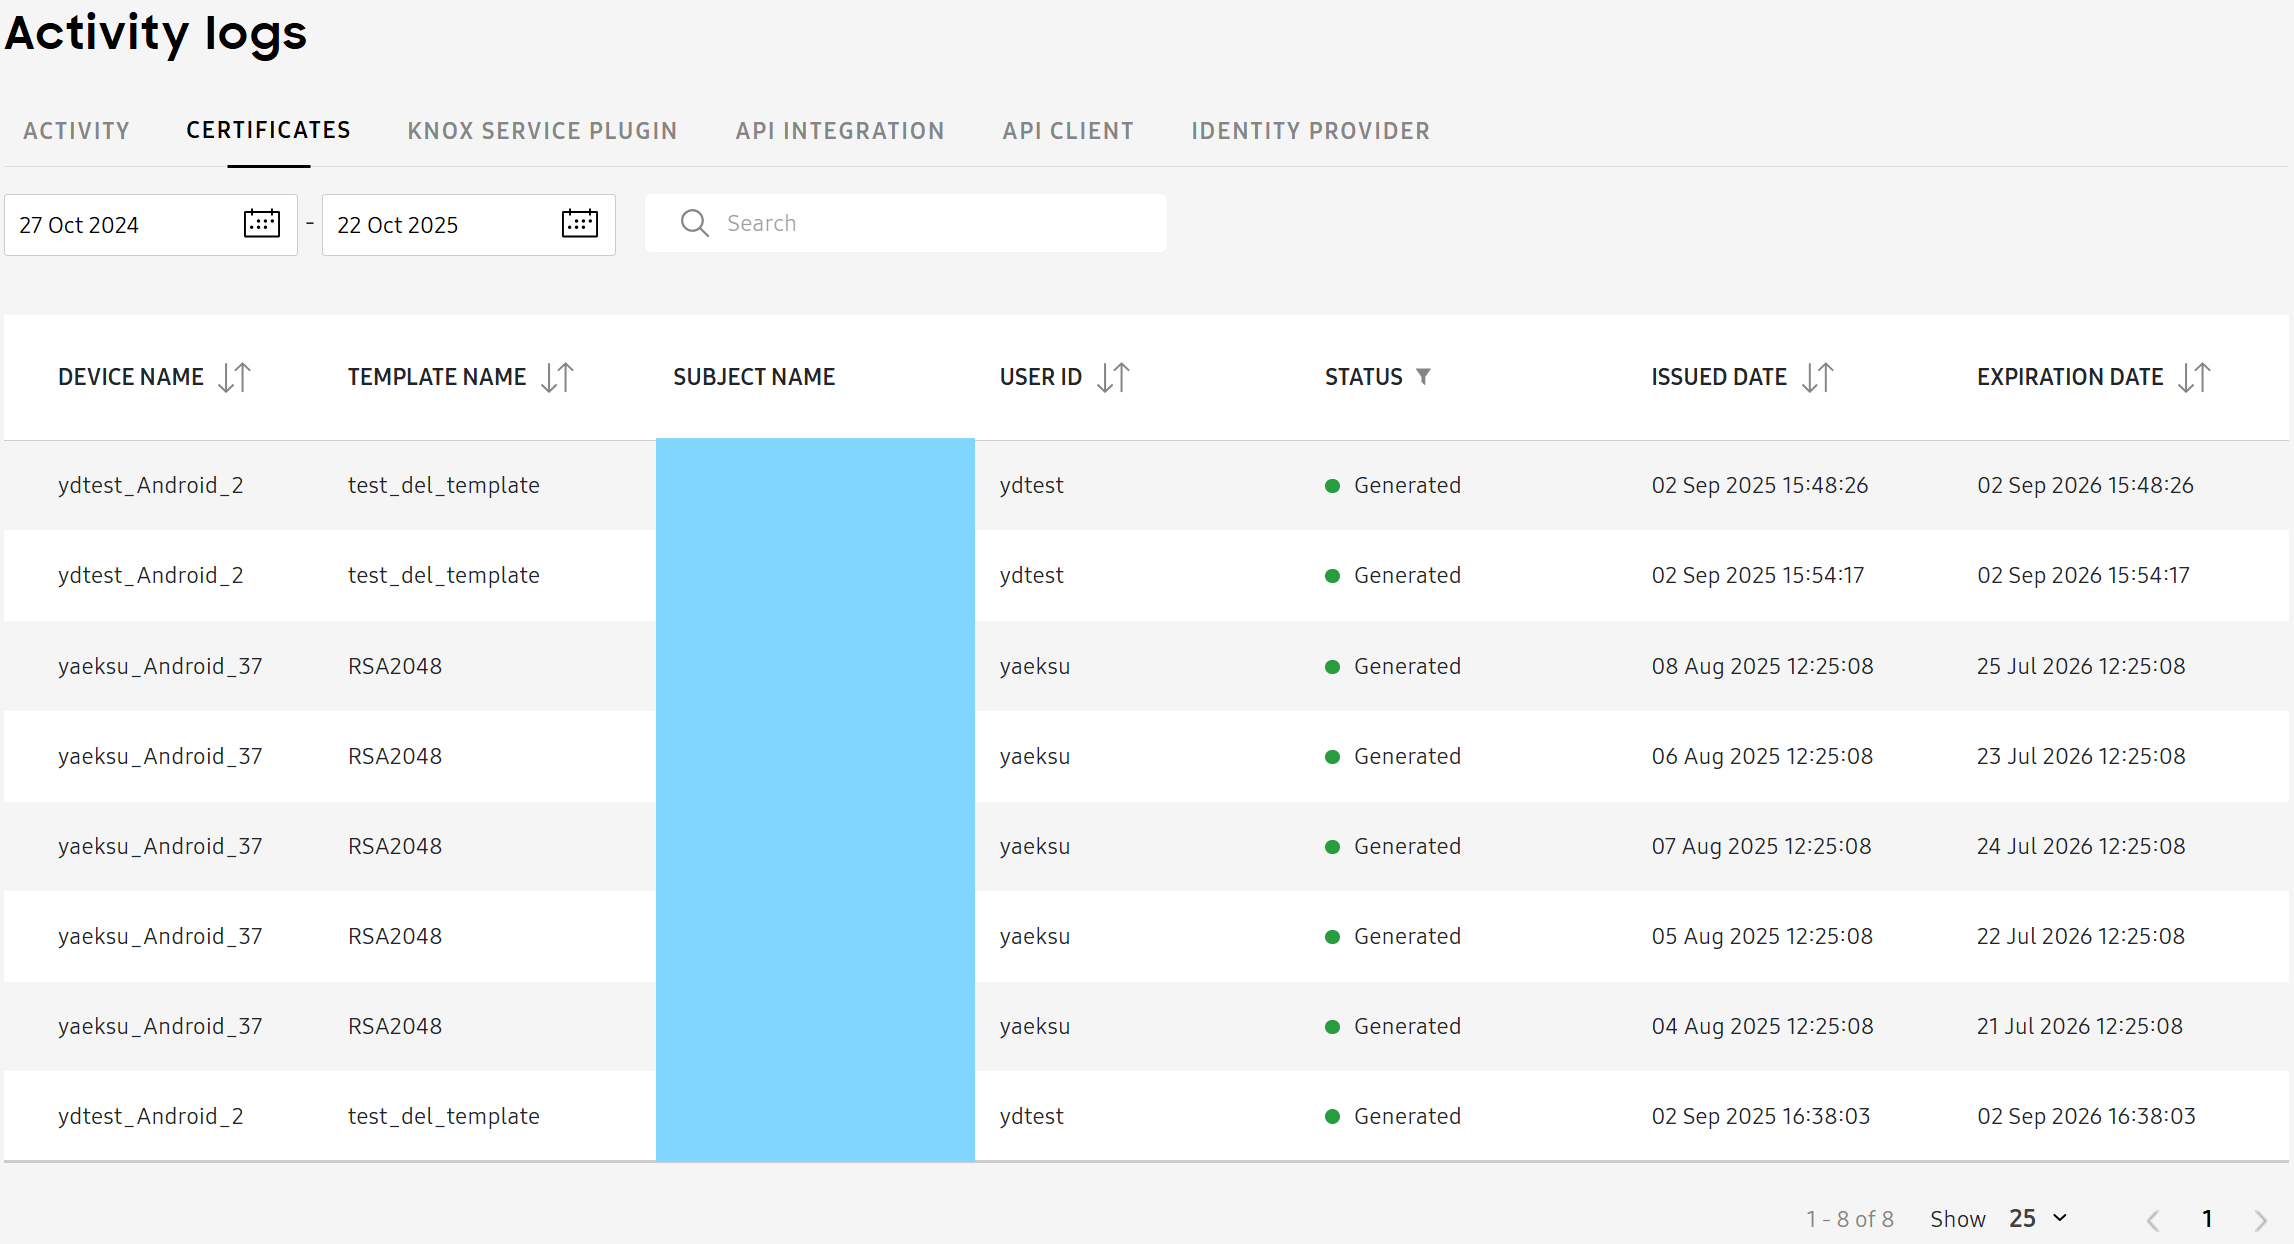
Certificates log
The CERTIFICATES tab allows you to view the issue history of certificates. By default, only logs from the past week are displayed, but you can view logs from up to a year prior.
The log table is organized into the following columns:
- DEVICE NAME — The device name.
- TEMPLATE NAME — The certificate template.
- SUBJECT NAME — The subject name set for the certificate template.
- USER ID — The ID of the user.
- STATUS — The certificate status. Supported values are Generated and Deleted.
- ISSUED DATE — The date the certificate was issued.
- EXPIRATION DATE — The date the certificate expires.
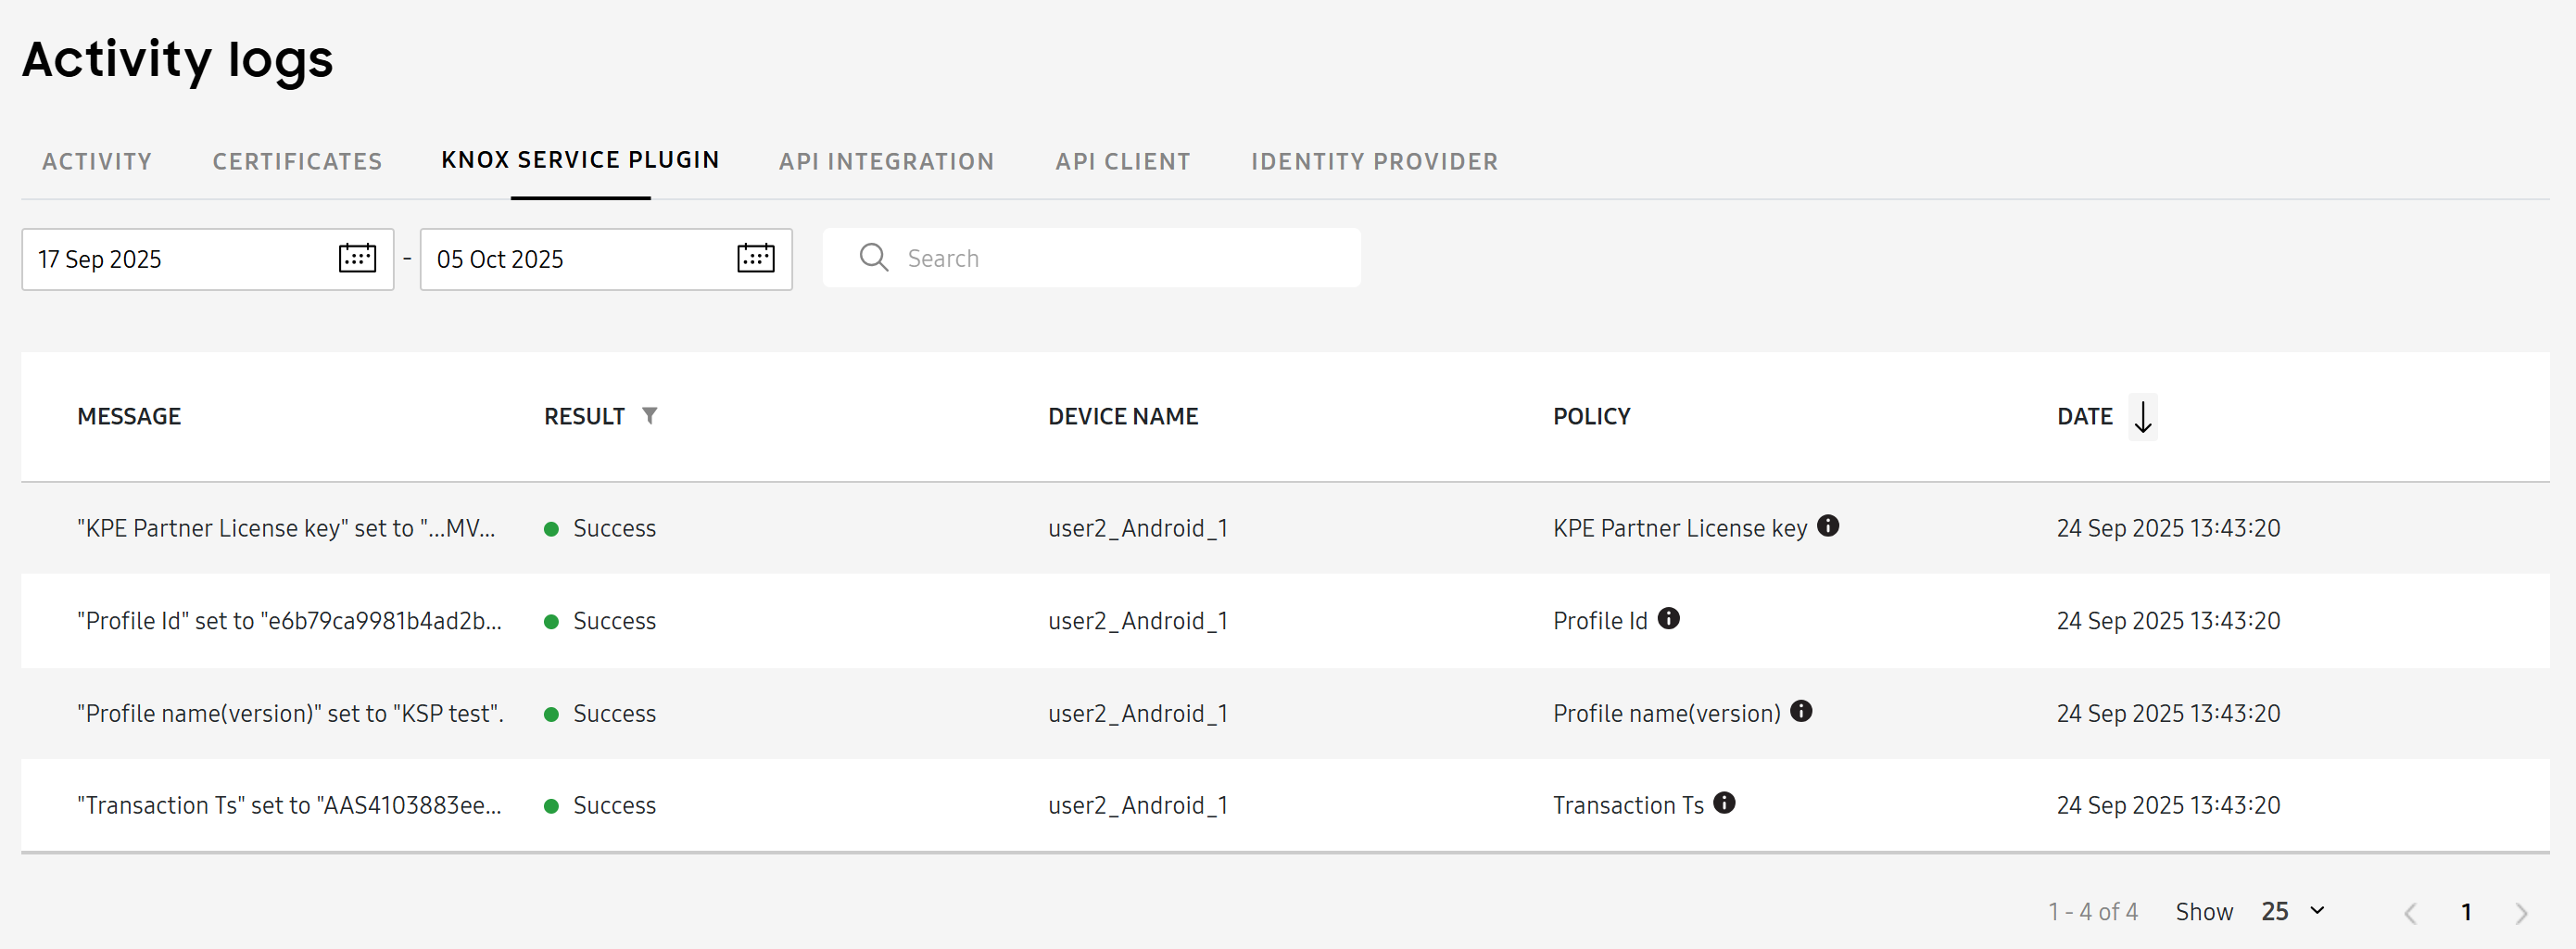
Knox Service Plugin log
The KNOX SERVICE PLUGIN tab allows you to view the message history of the Knox Service Plugin. The plugin, when installed on your devices, sends messages related to licensing and policy payloads. By default, only logs from the past week are displayed, but you can view logs from up to 93 days prior.
The log table is organized into the following columns:
- MESSAGE — The message log.
- RESULT — The result of the event, either Failure or Success.
- DEVICE NAME — The name of the device.
- POLICY — The Knox Service Plugin policy applied.
- DATE — The date of the event, based on the admin’s local time, in ascending or descending order.
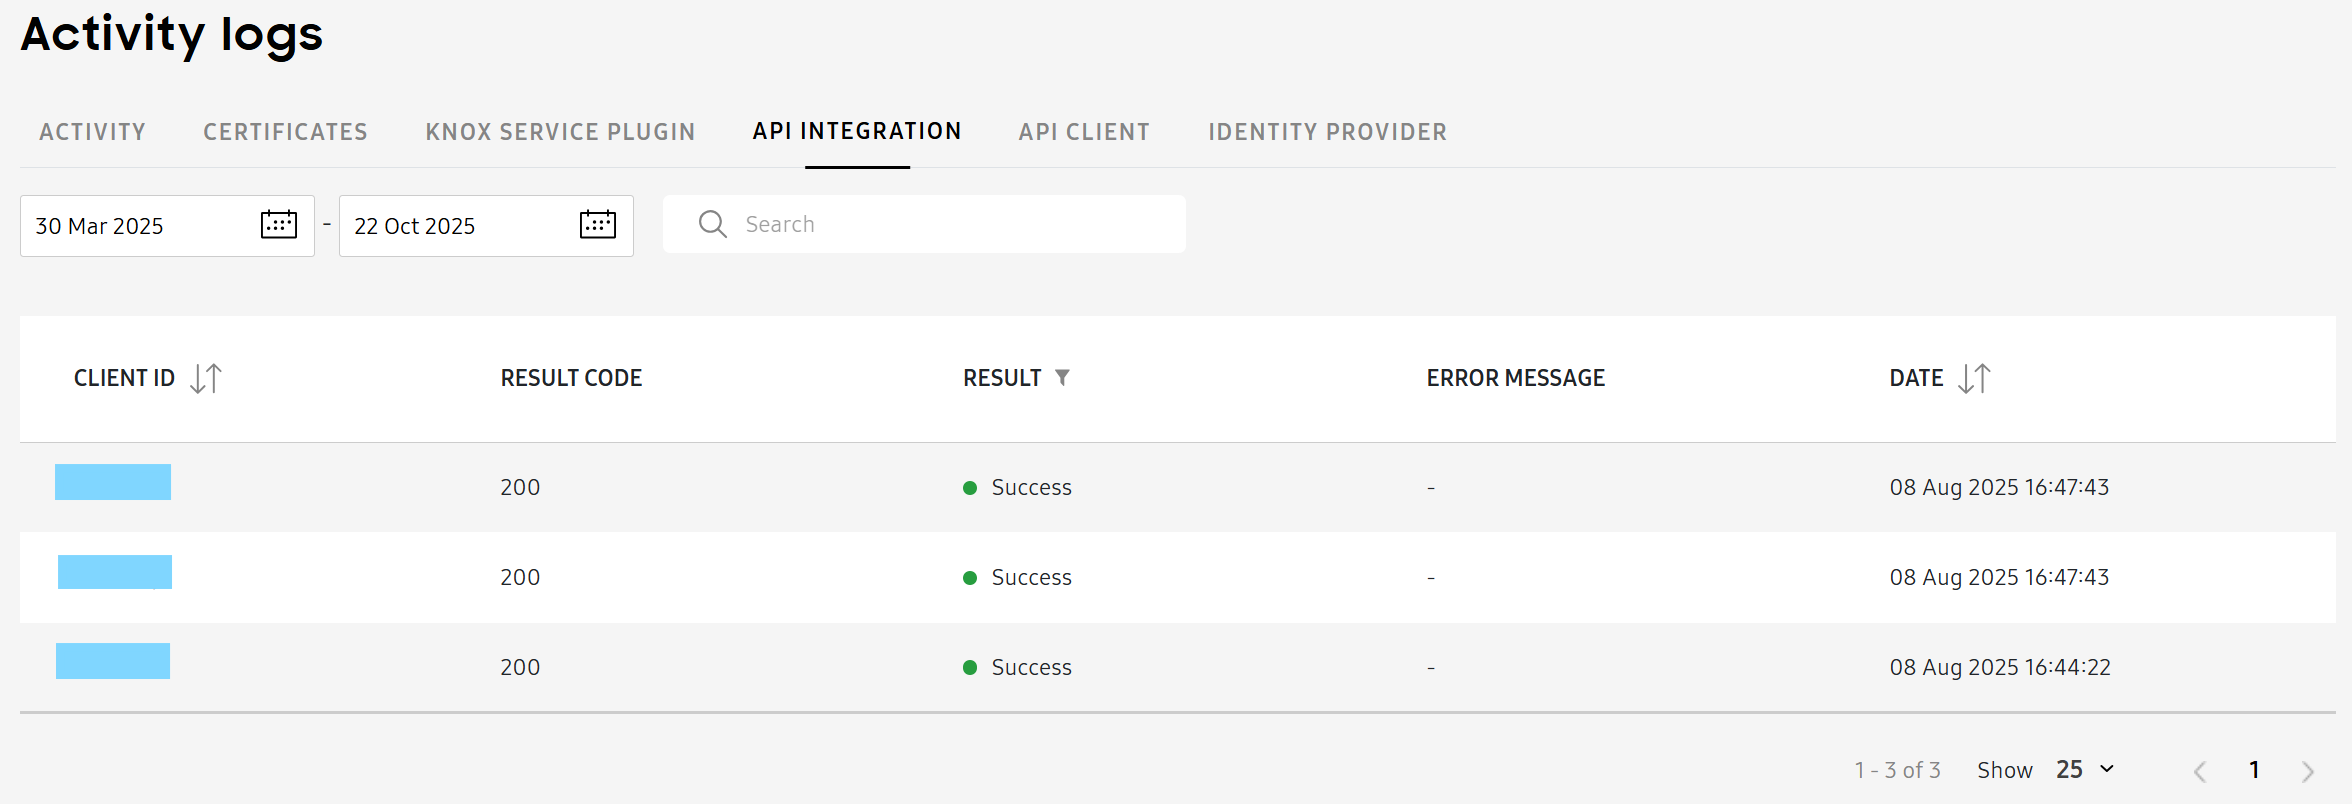
API integration logs
The API INTEGRATION tab allows you to view the records of successful and unsuccessful API calls. By default, only logs from the past week are displayed, but you can view logs from up to a year prior.
The log table is organized into the following columns:
- CLIENT ID — The unique ID assigned to the client.
- RESULT CODE — The response code associated with the result of the API call. See the API reference for more information about the meaning of each code.
- RESULT — The result of the API call, specifying whether it succeeded or failed.
- ERROR MESSAGE — If the API call failed, an error message explaining why displays in this column.
- DATE — The date of the event, based on the admin’s local time, in ascending or descending order.
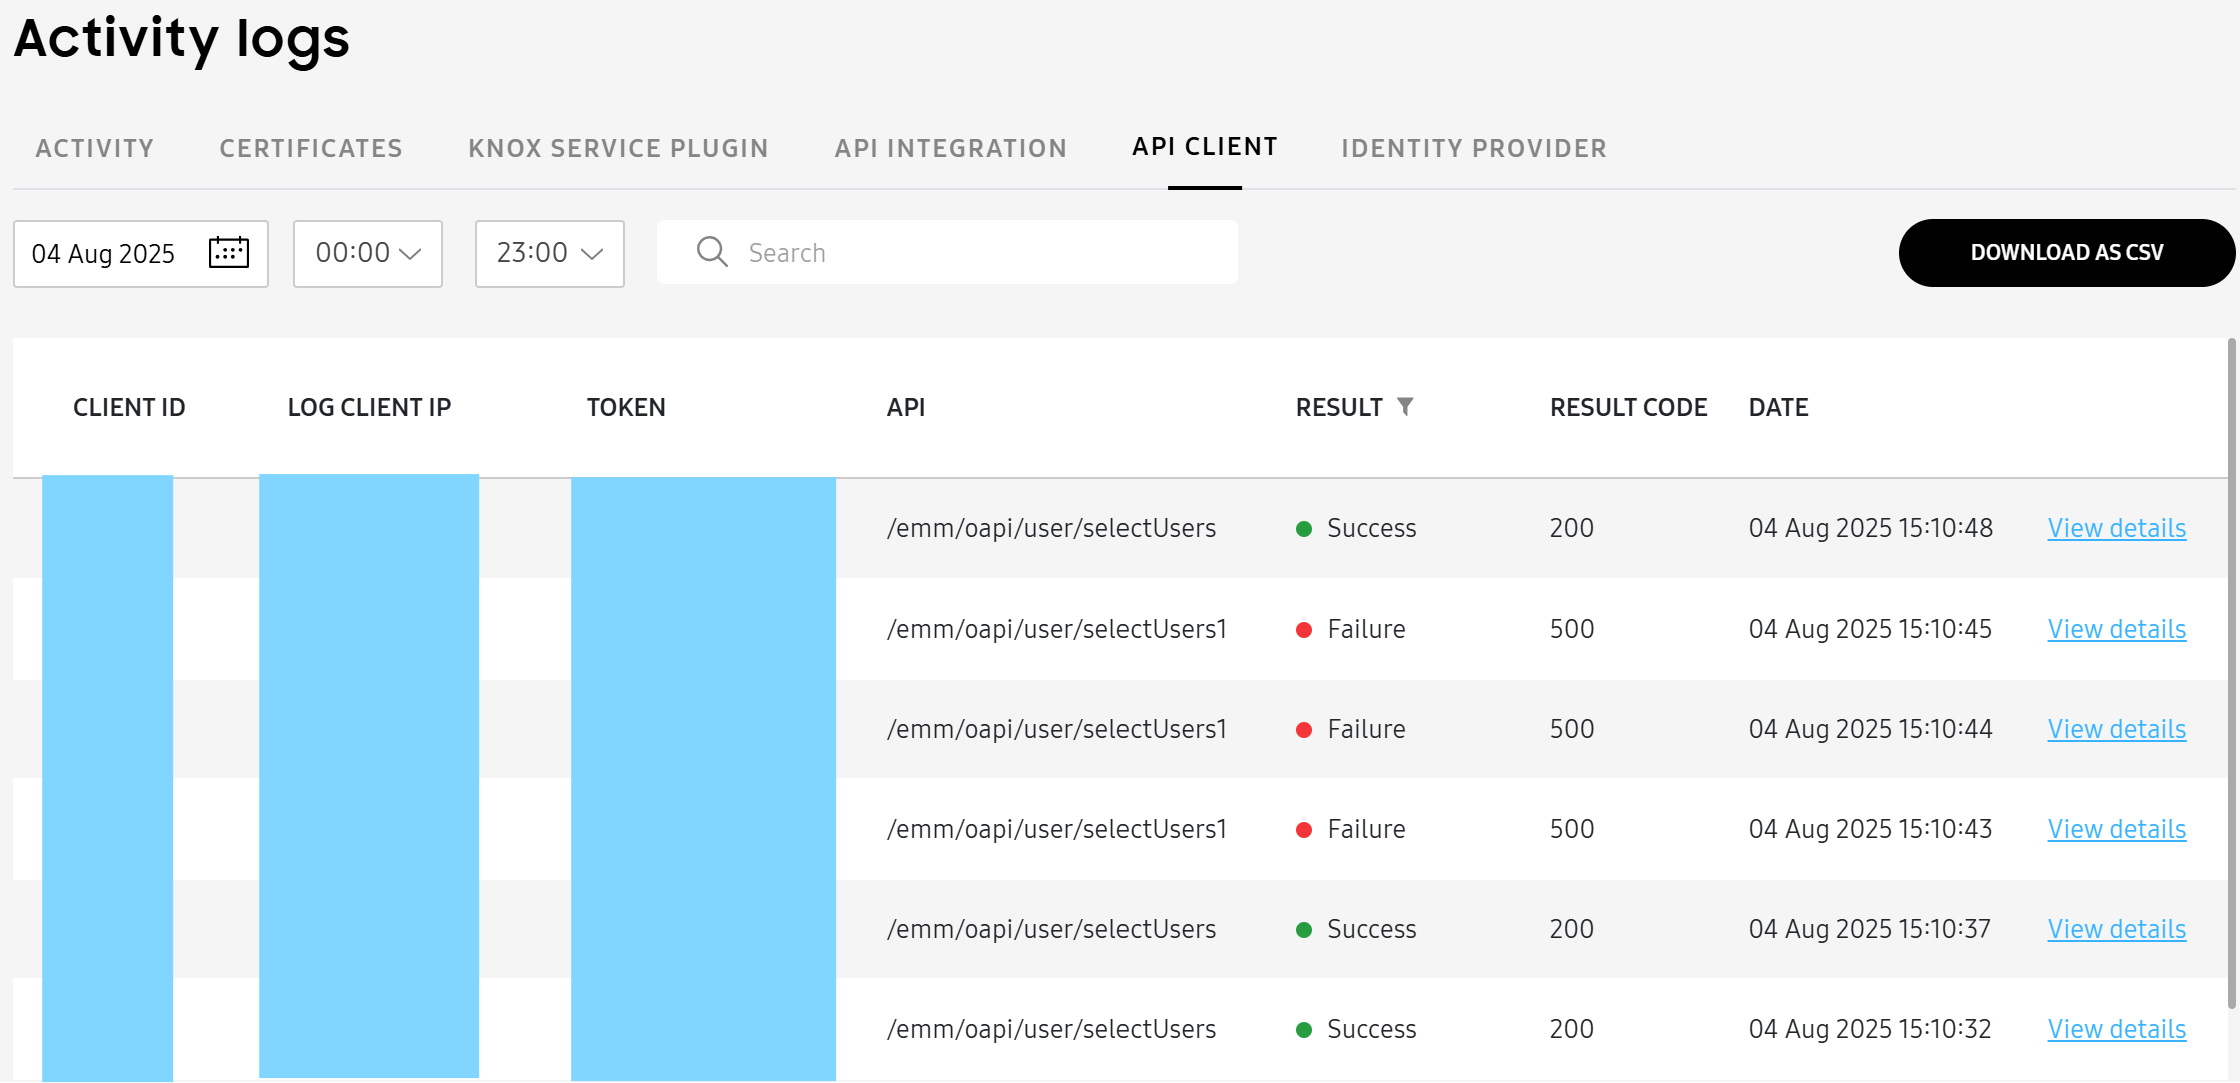
API client logs
The API CLIENT tab allows you to view all of the logs for the API clients you generate in the Knox Manage console. By default, only logs from the past week are displayed, but you can view logs from up to 93 days prior.
The log table is organized into the following columns:
- CLIENT ID — The unique ID assigned to the client.
- LOG CLIENT IP — The IP associated with the log client.
- TOKEN — The generated token.
- API — The API endpoint.
- RESULT — The result of the API client generation, specifying whether it succeeded or failed.
- RESULT CODE — The response code associated with the result of the API call. See the API reference for more information about the meaning of each code.
- DATE — The date of the event, based on the admin’s local time, in ascending or descending order.
To learn more about a log event, click View details. A pop-up with details about the client’s parameters and result appears.
You can download the API client log data as a CSV file by clicking DOWNLOAD AS CSV. Once the download is ready, it appears in your notifications on the top right of the Knox Admin Portal under (Notifications icon). Click DOWNLOAD on the notification. A ZIP file containing the logs downloads to your device.
Identity provider logs
You can view identity provider (IdP) event logs on the IDENTITY PROVIDER tab.
By default, only logs from the past week are displayed, but you can view logs from up to a year prior.

If you select the Connection type log, the log table is organized into the following columns:
- CONNECTION NAME — The name of the connection.
- TARGET — The users or groups synced from your identity provider.
- SYNC RESULT — The result of the target sync, specifying whether it succeeded or failed.
- If the sync result is successful and there is a corresponding event, you can click View details to see that connection event’s sync details, as well as change log. If unsuccessful, you can click View details to see an error log.
- START TIME — When the attempted sync with your identity provider began.
- END TIME — When the attempted sync with your identity provider ended.
If you select the User type log, the table is organized into the following columns:
- USER NAME — The name of the user.
- USER ID — The user ID.
- EVENT — The action that occured.
- If the event is Deleted, Ignored, or Error, you can click View error log to see that connection’s error log. If the event is Edited, you can click View change log.
- CONNECTION NAME — The name of the connection.
- DATE — When the action occured.
If you select the Group type log, the table is organized into the following columns:
- GROUP NAME — The name of the group.
- EVENT — The action that occured.
- If the event is Deleted, Ignored, or Error, you can click View error log to see that connection’s error log. If the event is Edited, you can click View change log.
- CONNECTION NAME — The name of the connection.
- DATE — When the action occured.
If you select the Organization type log, the table is organized into the following columns:
- ORGANIZATION NAME — The name of the organization.
- ORGANIZATION CODE — The code of the organization.
- PARENT ORGANIZATION CODE — The code of the parent organization.
- EVENT — The action that occured.
- If the event is Deleted, Ignored, or Error, you can click View error log to see that connection’s error log. If the event is Edited, you can click View change log.
- CONNECTION NAME — The name of the connection.
- DATE — When the action occured.
On this page
Is this page helpful?