Charge events
Last updated September 25th, 2024
The Charge events insight lets you know the number of times your devices connected to a battery charger during a selected reporting period. This information can help you determine if your users are charging their devices too often (which can result from excessive battery drain), or if users are not charging their devices regularly (which can lead to device down-time and loss of productivity).
Dashboard tile view

This insight’s dashboard tile view displays the total number of devices that connected to a battery, with data divided into three categories — devices that had either one charge event, two charge events, or more than two charge events.
In the tile’s notification area, you can receive an alert when a certain percentage of your fleet reports any battery charging events. This alert can be configured in the Dashboard setting’s THRESOLDS tab, under BATTERY > CHARGE EVENTS.
Expanded details page
The expanded details page for Charge events provides additional details to help you analyze your fleet’s battery charging behavior.
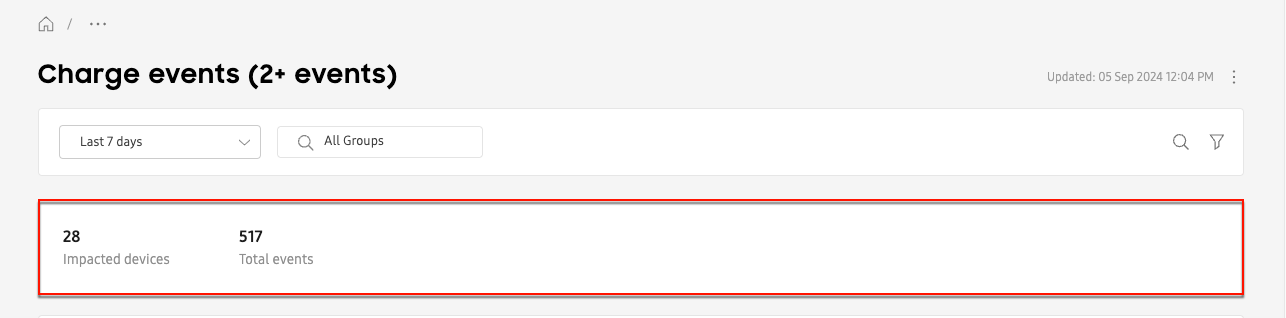
Summary
In the summary section, you’ll see a count of all devices impacted by two or more average daily charging events, as well as the total event count for those devices.
Impacted devices are devices that had two or more events per day on average, over the reporting period. In other words, if your reporting period is Last 7 days, then devices is included in the summary only if there 2 or more events per day, over the last 7 days. The following scenarios can help explain this logic in more detail:
Scenario 1: Devices included in the summary
- Reporting period: Last 7 days
- Day 1: 8 charge events
- Day 2: 2 charge events
- Day 3: 1 charge events
- Day 4: 1 charge events
- Day 5: 0 charge events
- Day 6: 1 charge events
- Day 7: 1 charge events
- Total event count = (8+2+1+1+0+1+1) = 14 events.
- Average event count per day = 14 events/7 days = 2.0 events/day.
Since there were 2.0 events per day on average, the device would be an impacted device.
Scenario 2: Devices not included in the summary
- Reporting period: Last 7 days
- Day 1: 8 charge events
- Day 2: 0 charge events
- Day 3: 2 charge events
- Day 4: 1 charge events
- Day 5: 0 charge events
- Day 6: 0 charge events
- Day 7: 2 charge events
- Total event count = (8+0+2+1+0+0+2) = 13 events.
- Average event count per day = 13 events/7 days = 1.85 events/day.
Since there were 1.85 events per day on average (less than 2.0), the device would not be an impacted device.
Chart
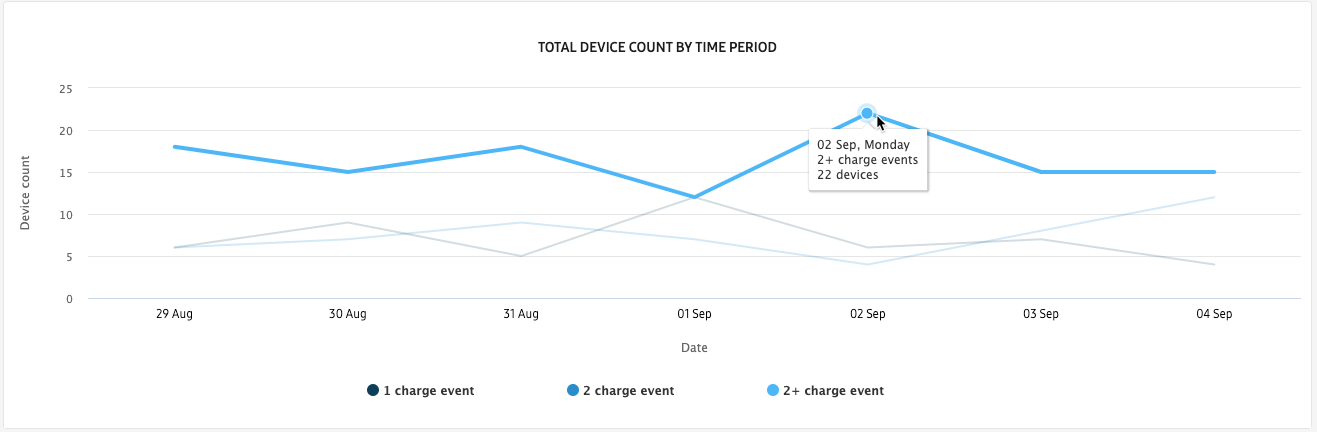
The chart displays the total number of devices that had a charge event during the selected reporting period. Click a category in the chart’s legend to show or hide the line graph on the chart. Hover over each data point on the chart to view details, such as the total number of devices and the event count for that day.
Device list
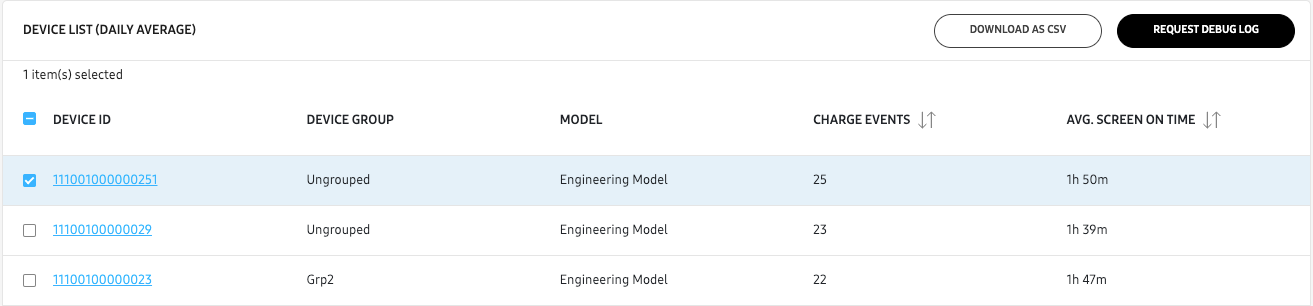
The DEVICE LIST table below the chart shares the same data logic as the summary bar. In the table, you’ll see every device that had an average of two or more events per day, over the selected reporting period. Each row of the table provides a breakdown of the device’s total event count, average screen time, and group and model information.
Click a Device ID to view the device details. To help troubleshoot devices with excessive charging events, you can also select devices from the list and click REQUEST DEBUG LOG. Once the user accepts the log request, you can view the log details on the Diagnostics page. See View diagnostics to learn more about Knox Asset Intelligence’s debug logs and diagnostics features.
CSV file
To view more details about your fleet’s charge events, you can download a CSV file from the device list. Select a device, then click DOWNLOAD AS CSV. Each row of the CSV file corresponds to a single charge event (that is, each time the device connected to a charger).
The CSV file’s Time until fully charged column shows the estimated time it would have taken to fully charge the device — at the time the charging event occured. This data is not supported on devices connected to wireless charging accessories.
On this page
Is this page helpful?