Knox Service Plugin status
Last updated November 7th, 2024
Knox Asset Intelligence provides integrated Knox Service Plugin (KSP) information on the dashboard to help you monitor the deployment status of your KSP policies. By default, the Knox Service Plugin (KSP) status tile is disabled on your dashboard. You can enable it in the dashboard settings.
Every time KSP data is updated through an EMM solution, the KSP agent passes it to the Knox Asset Intelligence agent on the device, which in turn uploads the data to the server within 24 hours. On the Knox Asset Intelligence console, you can view or download a policy report or the full policy schema to help you troubleshoot KSP-related issues on your devices.
You can also retrieve this information with the Knox Asset Intelligence API. See how you can get started with our Knox cloud services APIs.
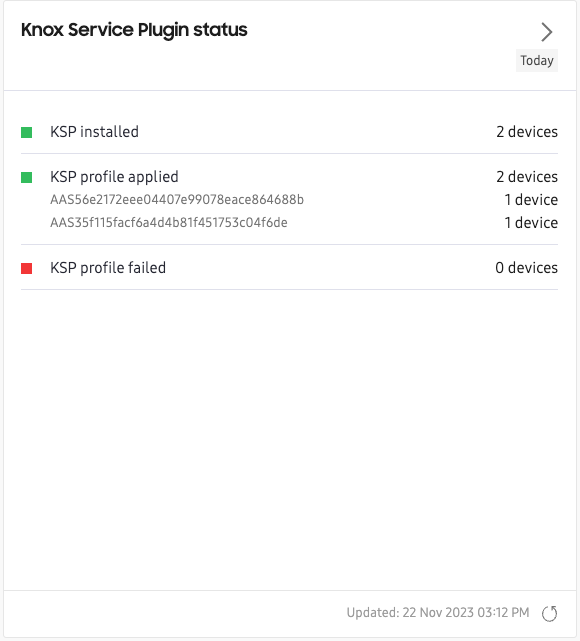
Dashboard tile view
The KSP dashboard tile shows you how many of your devices have KSP installed, which profiles were successfully applied, and which profiles failed to apply.
Expanded details page
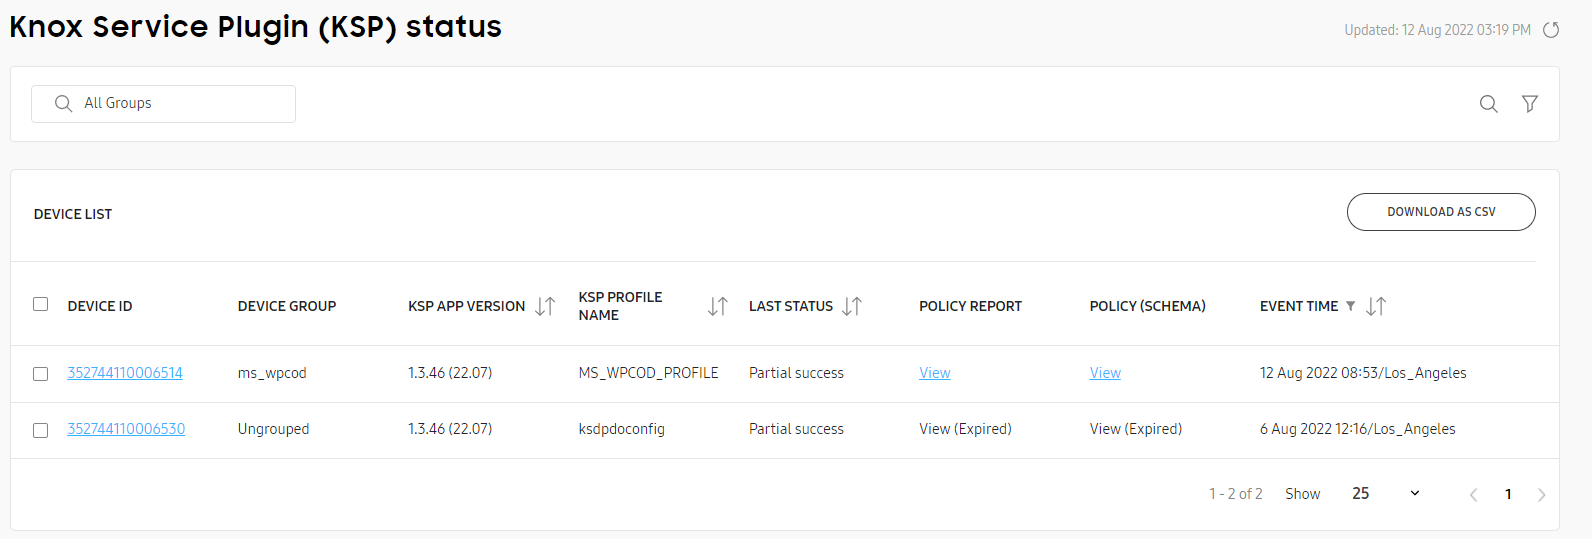
The expanded details page contains a list of devices with KSP installed, as well as the following information:
- DEVICE ID — The unique identifier of the device.
- DEVICE GROUP — The name of the group the device belongs to.
- KSP APP VERSION — The KSP version currently installed on the device.
- KSP PROFILE NAME — The name of the KSP profile assigned to the device, defined by the EMM.
- LAST STATUS — The reported status after the KSP policies were last applied to the device: Success, Partial success, or Fail.
- POLICY REPORT — A failure report provided by KSP, which is only available if the last status is either Partial success or Fail. Click View to open it in a dialog, where you can also download it in JSON format. The file is deleted after 30 days.
- POLICY (SCHEMA) — The full policy file provided by KSP. Click View to open it in a dialog, where you can also download it in JSON format. The file is deleted after 30 days.
- EVENT TIME — The time the KSP policies were last applied to the device.
On this page
Is this page helpful?