View diagnostics
Last updated June 17th, 2026
About diagnostic logs
Diagnostic logs provide detailed information related to a device’s activities and overall operation, at the time of request. You can use the information on this page to help identify and troubleshoot issues related to your device fleet’s app, battery, or network performance.
Request diagnostic logs
To request a Diagnostic log:
-
Go to the Devices page, then select one or more devices and click ACTIONS > Request diagnostics device log.
-
In the Request diagnostics device log popup, select the type of log file you want to request.
| Log type | Description |
|---|---|
| Device debug log | Helps you identify issues related to device apps, battery, network connectivity, or overall operation. |
| TCPdump log | Helps you identify network traffic issues between the device and servers. |
TCPdump logs can only be captured from devices running Android 12 or later.
-
(Optional) If you want to request debug logs without user consent, enable the Request silently option. This option is only available on fully managed and dedicated devices (such as kiosks). Devices that aren’t fully managed (such as company-owned devices with a work profile) will always prompt the user for consent before collecting log data.
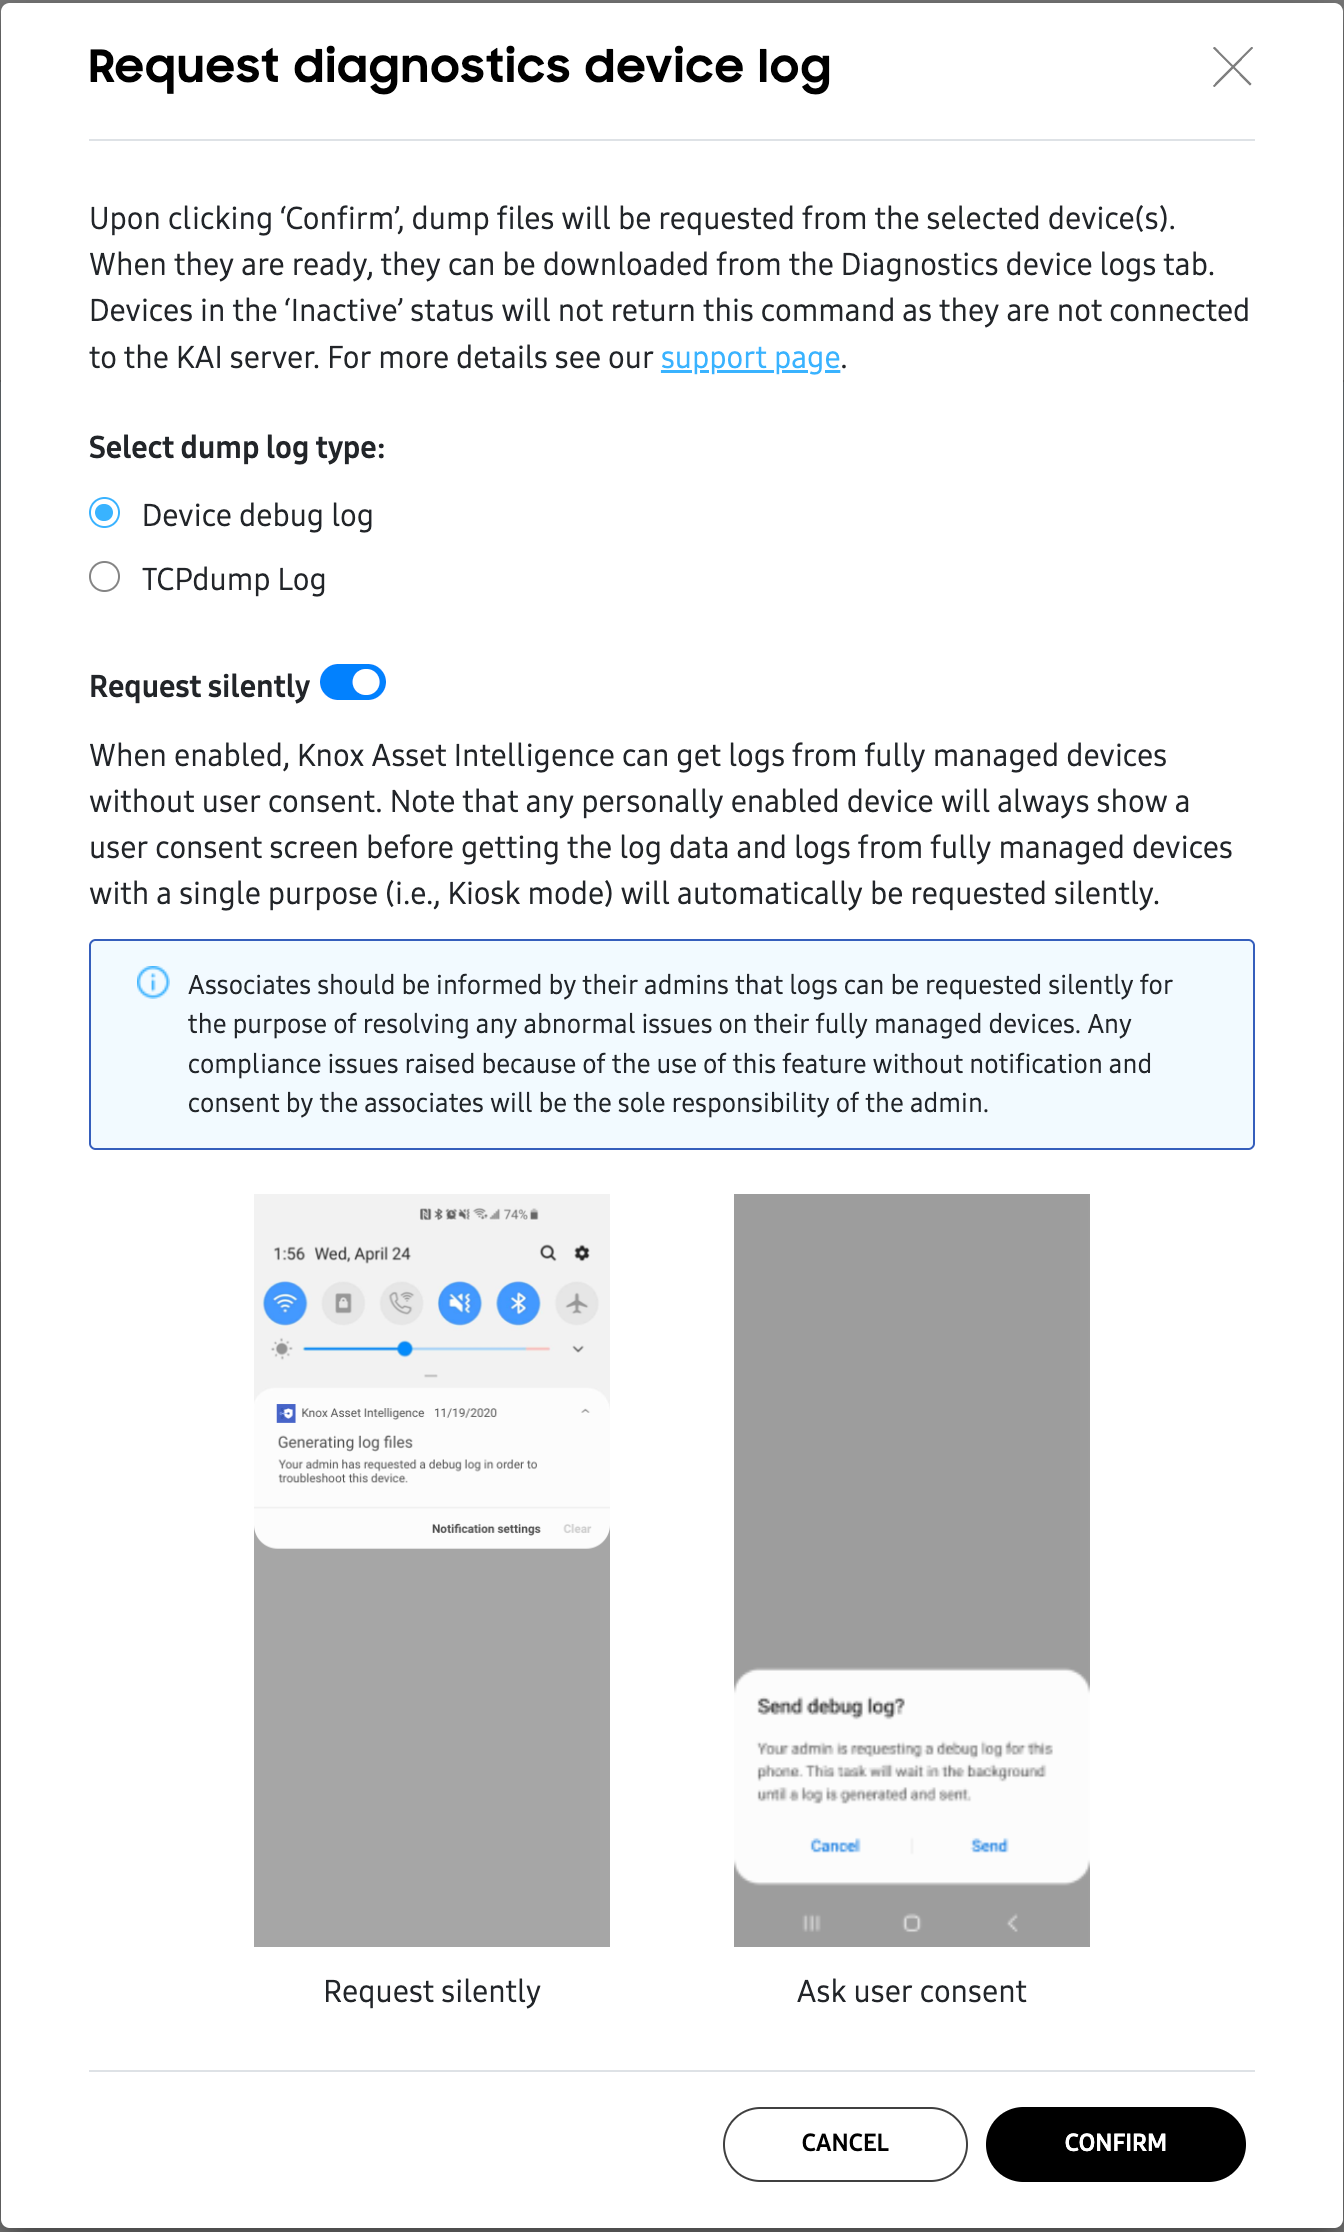
This option only works when selecting Device debug logs. You can’t silently request TCPdump logs from the device.
-
Click CONFIRM to make your device log request.
Device users can also send a Diagnostic log directly from the Knox Asset Intelligence agent whenever they encounter an issue. Once a log is successfully sent from the agent, you’ll see an entry in the diagnostic logs table with a Completed (Self-upload) to let you know that the log was sent by the user.
View diagnostic logs
When you view the Diagnostics page, you’ll land on the default DIAGNOSTIC LOGS tab. Similar to the Devices page, the diagnostic logs table displays a list of device IDs, along with diagnostics-related data. If you click a DEVICE ID, the Expanded device details panel appears, providing additional information about your device.
You can customize the table by clicking (More actions icon) and selecting up to six additional columns to display. Once diagnostic log files are delivered to the server, they are available for viewing and downloading for up to 30 days (by default) from the time of creation. To change the retention period beyond 30 days, you can make a request to Samsung Knox Support.
The following information is available in the table:
| Field | Description |
|---|---|
| DEVICE ID | The device's unique identifier (always enabled). If the device supports two SIMs, only the primary IMEI is shown. |
| DEVICE GROUP | The name of the group the device belongs to. If the device doesn't belong to a group, its status is Ungrouped. |
| STATUS |
The current status of the diagnostic log request. The statuses are:
|
| DELIVERY | The download link for the log file, if available. |
| CATEGORY | The log type, whether TCPdump, Battery history, or All. |
| ERROR REPORT | The details of any error messages sent by a device user using the error reporting feature of the agent app. |
| UPDATED | The time and date when the device debug log status was last updated. |
| REQUESTED BY | The email address of the admin who requested the log. |
About snapshots
Similar to a diagnostic log, a Device snapshot provides detailed information related to a device’s overall operation, at the moment of capture. However, unlike with diagnostic logs, snapshots can’t be downloaded for offline viewing or further analysis.
Request a Snapshot
To request a Snapshot:
- Go to the Devices page, then select one or more devices.
- Click ACTIONS, then select one of the following snapshot request options:
- Request device snapshot: This requests a snapshot immediately, without any follow-up action.
- Schedule device snapshot: This requests a snapshot as soon as a specific event is triggered. See Schedule snapshot below for additional details.
Schedule a snapshot
When requesting a device snapshot, you can choose to get a snapshot as soon as a device triggers a specific event. This is known as “scheduling” the snapshot. You can schedule multiple snapshots for different devices, and each schedule can have more than one event trigger.
To schedule a snapshot:
-
After selecting Schedule device snapshot from the device Actions menu, select your event triggers. The following options are available:
Trigger Description When any app event occurs Triggers a snapshot when any app on the device experiences an ANR (App Not Responding), FC (Forced Close), or Abnormal event. When any battery drain event occurs Triggers a snapshot when the device’s battery experiences a battery drain beyond the acceptable threshold set in your Dashboard Settings. When the mobile network signal strength is Not good or Unusable Triggers a snapshot the device’s mobile network signal strength drops between -81 dBm and -90 dBm (Not good), or -91 dBm and lower (Unusable). 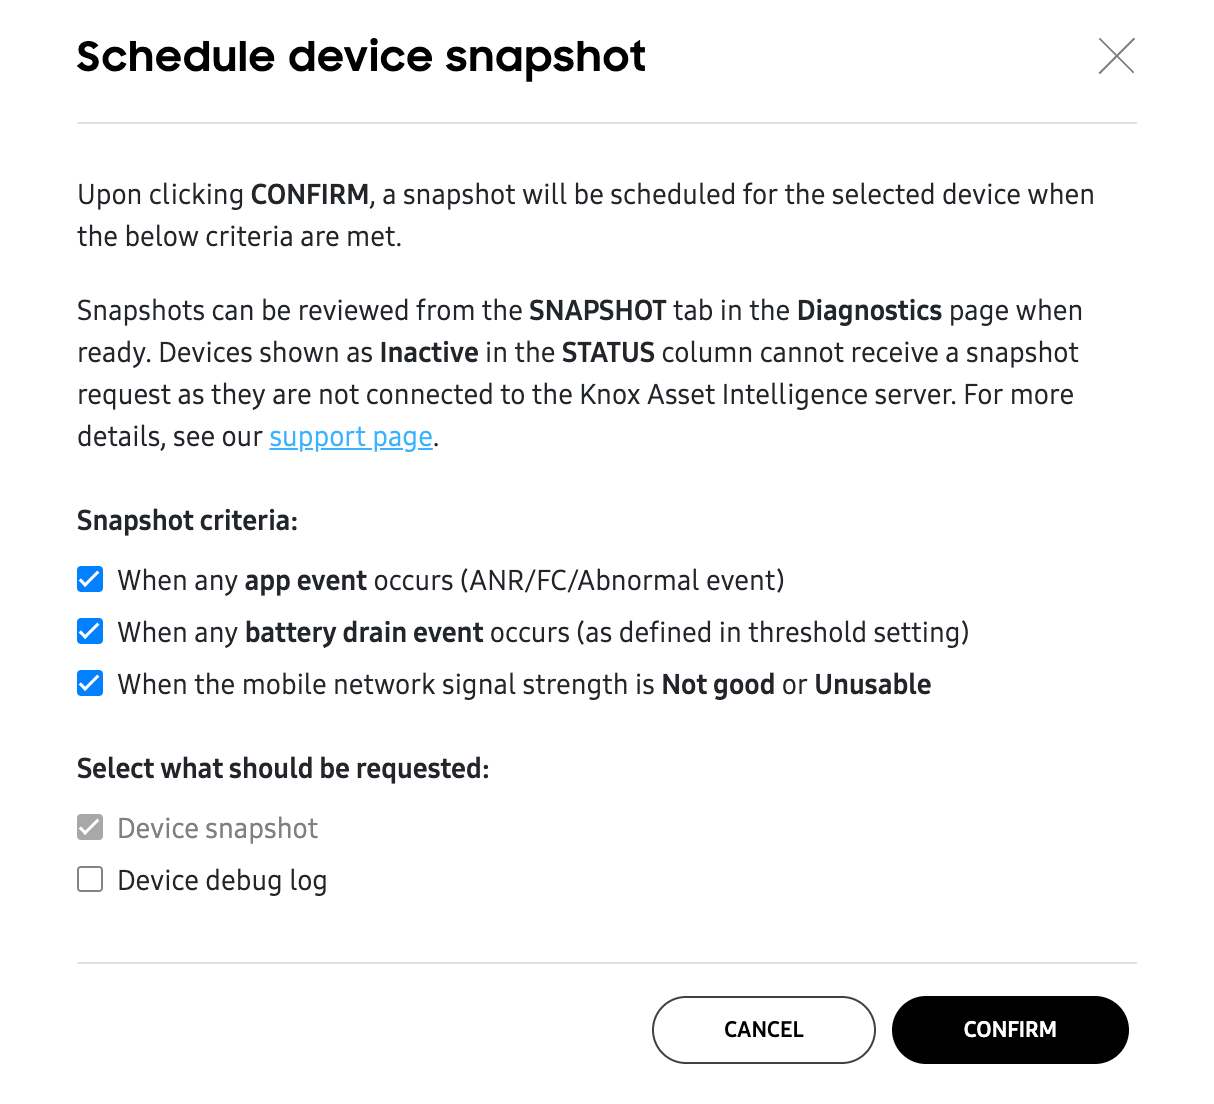
If a scheduled snapshot has more than one event trigger, the snapshot will be generated after the first event occurs, and the snapshot will be marked as complete.
-
Select whether you want to request an optional Device debug log along with the snapshot, and whether you want to request it silently. If selected, the Device debug log will only be captured if the device meets one of the snapshot event trigger conditions.
-
Click CONFIRM to schedule your snapshot.
View Snapshots
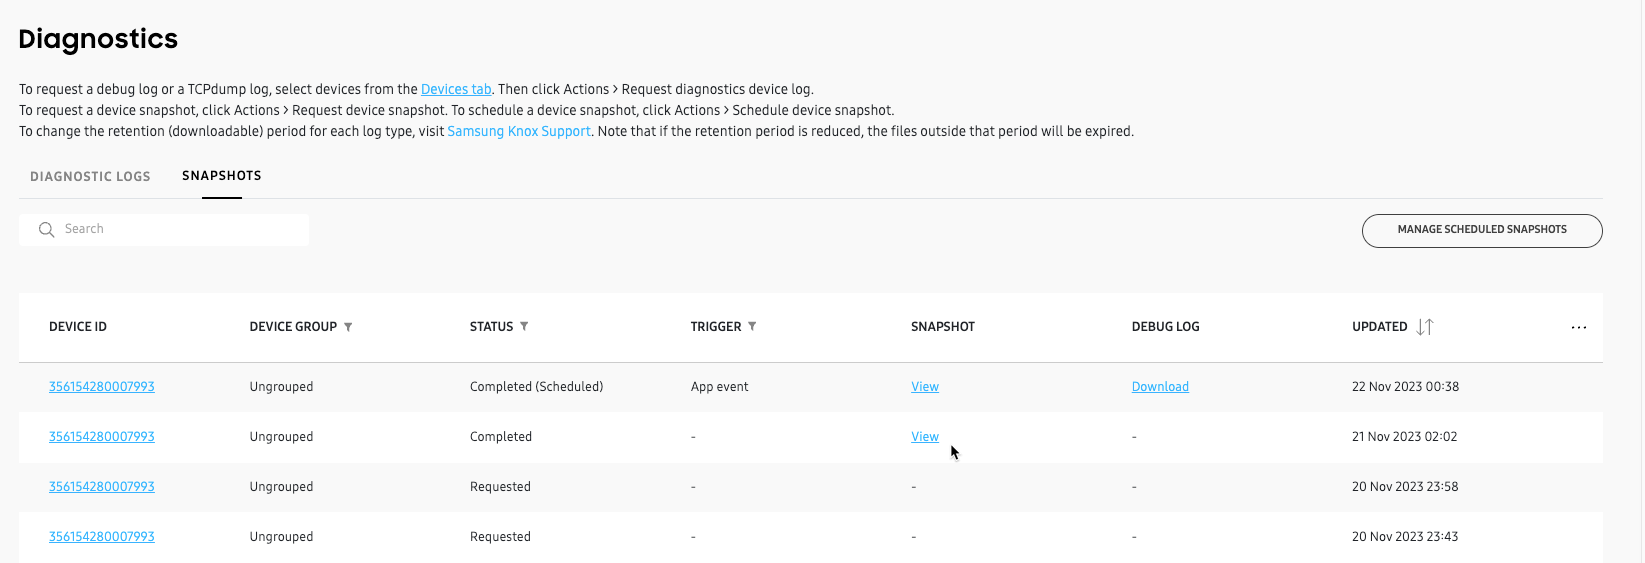
Once a snapshot request is made, you can view the information on the SNAPSHOTS tab of the Diagnostics page. Similar to the Devices page, a table of device IDs, along with their snapshots-related data is shown. If you click a DEVICE ID, the Expanded device details panel appears, providing additional information about your device.
You can customize the table by clicking (More actions icon) and selecting up to six additional columns to display. Once snapshots are delivered to the server, they are available for viewing, and any accompanying device debug logs are available for downloading for up to 30 days (by default) from the time of creation, after which the download and view links expire. To change the retention period beyond 30 days, you can make a request to Samsung Knox Support.
The following information is available in the snapshots table:
| Field | Description |
|---|---|
| DEVICE ID | The device's unique identifier (always enabled). If the device supports two SIMs, only the primary IMEI is shown. |
| DEVICE GROUP | The name of the group the device belongs to. If the device doesn't belong to a group, its status is Ungrouped. |
| STATUS |
The current status of the request. The statuses are:
|
| TRIGGER | The snapshot criteria, if a snapshot was scheduled. |
| SNAPSHOT | Where you'll find the View link for all successful snapshot requests. If your snapshot is older than your retention policy period, you'll see View (Expired). |
| DEBUG LOG | Where you'll find the Download link for successful scheduled snapshots that included the optional device debug log. If your device debug log is older than the retention policy period, you'll see Download (Expired). If the user does not grant device debug log permissions, you'll see – (Denied). |
| UPDATED | The time and date when the snapshot status was last updated. |
| REQUESTED BY | The email address of the admin who requested the snapshot. |
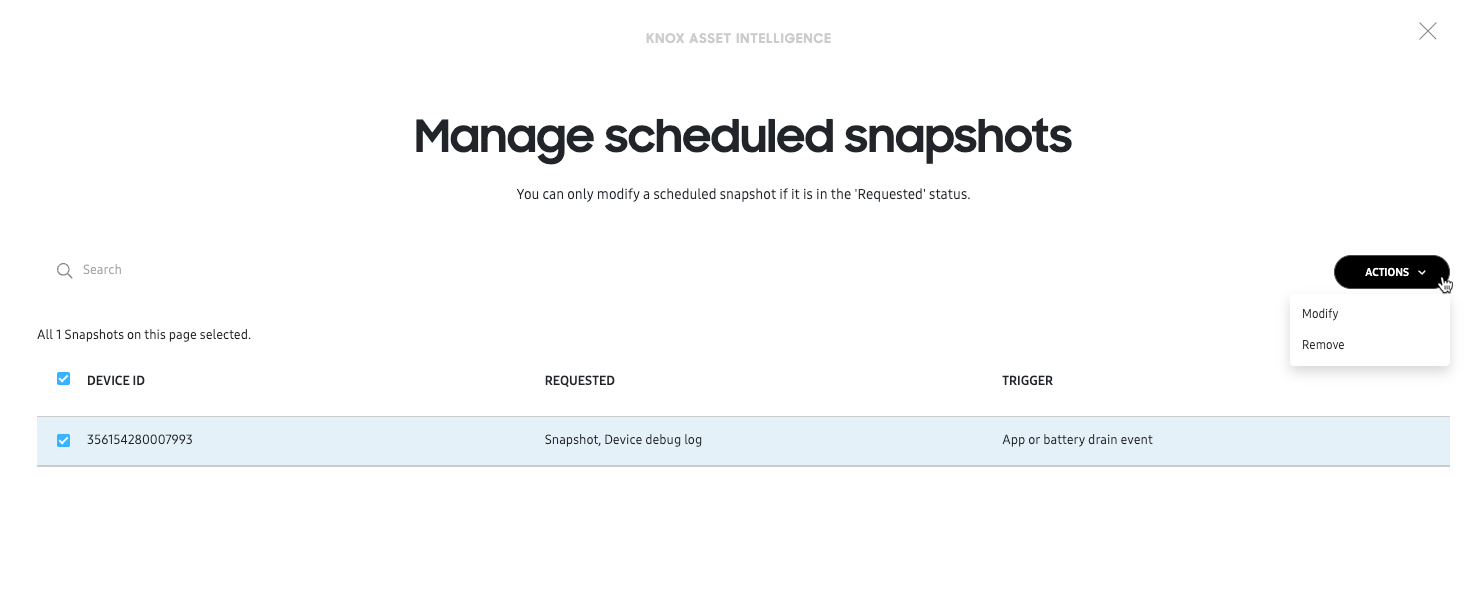
If you’ve scheduled one or more Snapshots, you can click MANAGE SCHEDULED SNAPSHOTS near the top-right corner of the page to view a list of all scheduled snapshots for your fleet.
In the list, you’ll see the device ID, the type of request (Snapshot or Snapshot with Device debug log), and the trigger criteria. Select a device from the list and click ACTIONS to either Modify the schedule details (which lets you change your trigger criteria), or Remove the device from the schedule, thus cancelling the request.
Scheduled snapshots can only be modified if they are showing a Requested (Scheduled) status. If a snapshot is triggered by the device, the snapshot status is changed to Uploading (Scheduled), and thus cannot be modified.
Once the scheduled Snapshot (and its accompanying Device debug log) is triggered — whether the snapshot succeeded or failed — the device disappears from the Managed scheduled snapshots list.
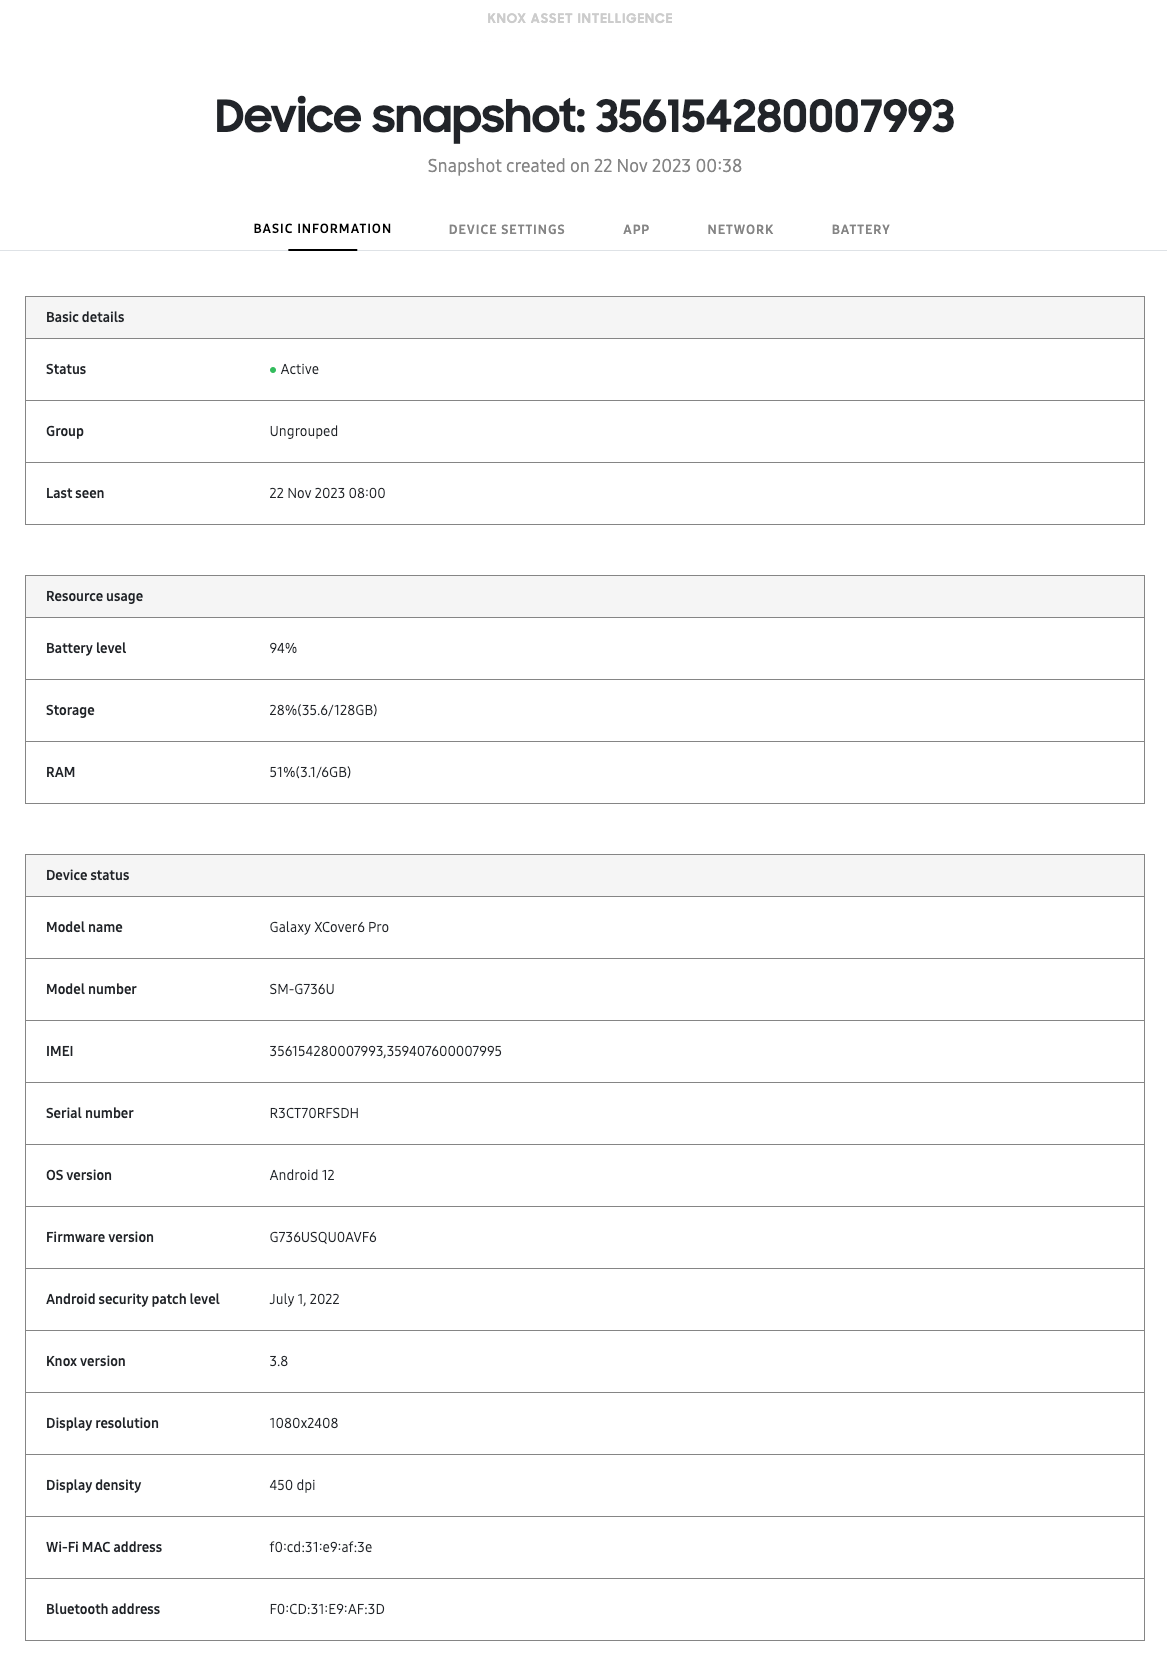
If the snapshot request is successful, it appears on the SNAPSHOTS tab of the Diagnostics page. Click View in the table’s SNAPSHOT column to view the snapshot details on a new page, then use the tabs to navigate between the different types of information available.
The following tabs available:
| Tab | Description |
|---|---|
| BASIC INFORMATION | Provides system information, like the current battery, storage, and RAM usage levels, plus the IMEI, serial number, Android version, and other related data. |
| DEVICE SETTING | Lets you know whether system settings like Bluetooth, Wi-Fi, Wi-Fi calling, location, and others are enabled or disabled. |
| APP | Provides a quick summary of your app insights, letting you see the top five apps with the highest battery and data consumption, as well as any app issues within the last 24 hours. |
| NETWORK | Lets you see your Wi-Fi and mobile network signal strength at the time of capture, as well as other network information like SIM information, SSID, MAC addresses, and more. |
| BATTERY | Provides battery status information, like the current state of health, voltage, and charging status. Also, reports any battery charging events within the last 24 hours. |
On this page
Is this page helpful?