Data usage by connection type
Last updated December 6th, 2023
The Data usage by connection type insight let you easily see how much mobile and Wi-Fi data your fleet has consumed, allowing you to predict and prevent mobile data over-usage and excessive data costs.
Dashboard tile view
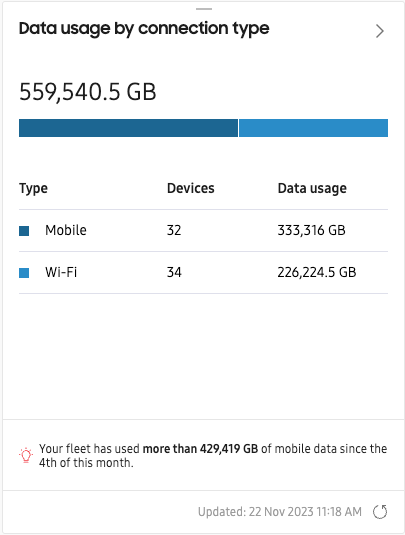
In the dashboard tile view, you’ll see the total data consumption across your entire fleet, along with the total number of devices that consumed Mobile and Wi-Fi data over the reporting period. Hover over each segment of the bar chart to also view the total mobile and Wi-Fi connection times for all devices in the fleet.
At the bottom of the tile, you can receive mobile data consumption alerts based on a pre-defined threshold. For example, you can receive alerts for when your fleet consumes more than 100 GB of mobile since the beginning of the month. This data can help you monitor and prevent possible data overage charges from your carrier.
You can configure the mobile data usage alert threshold in Dashboard settings.
Expanded details page
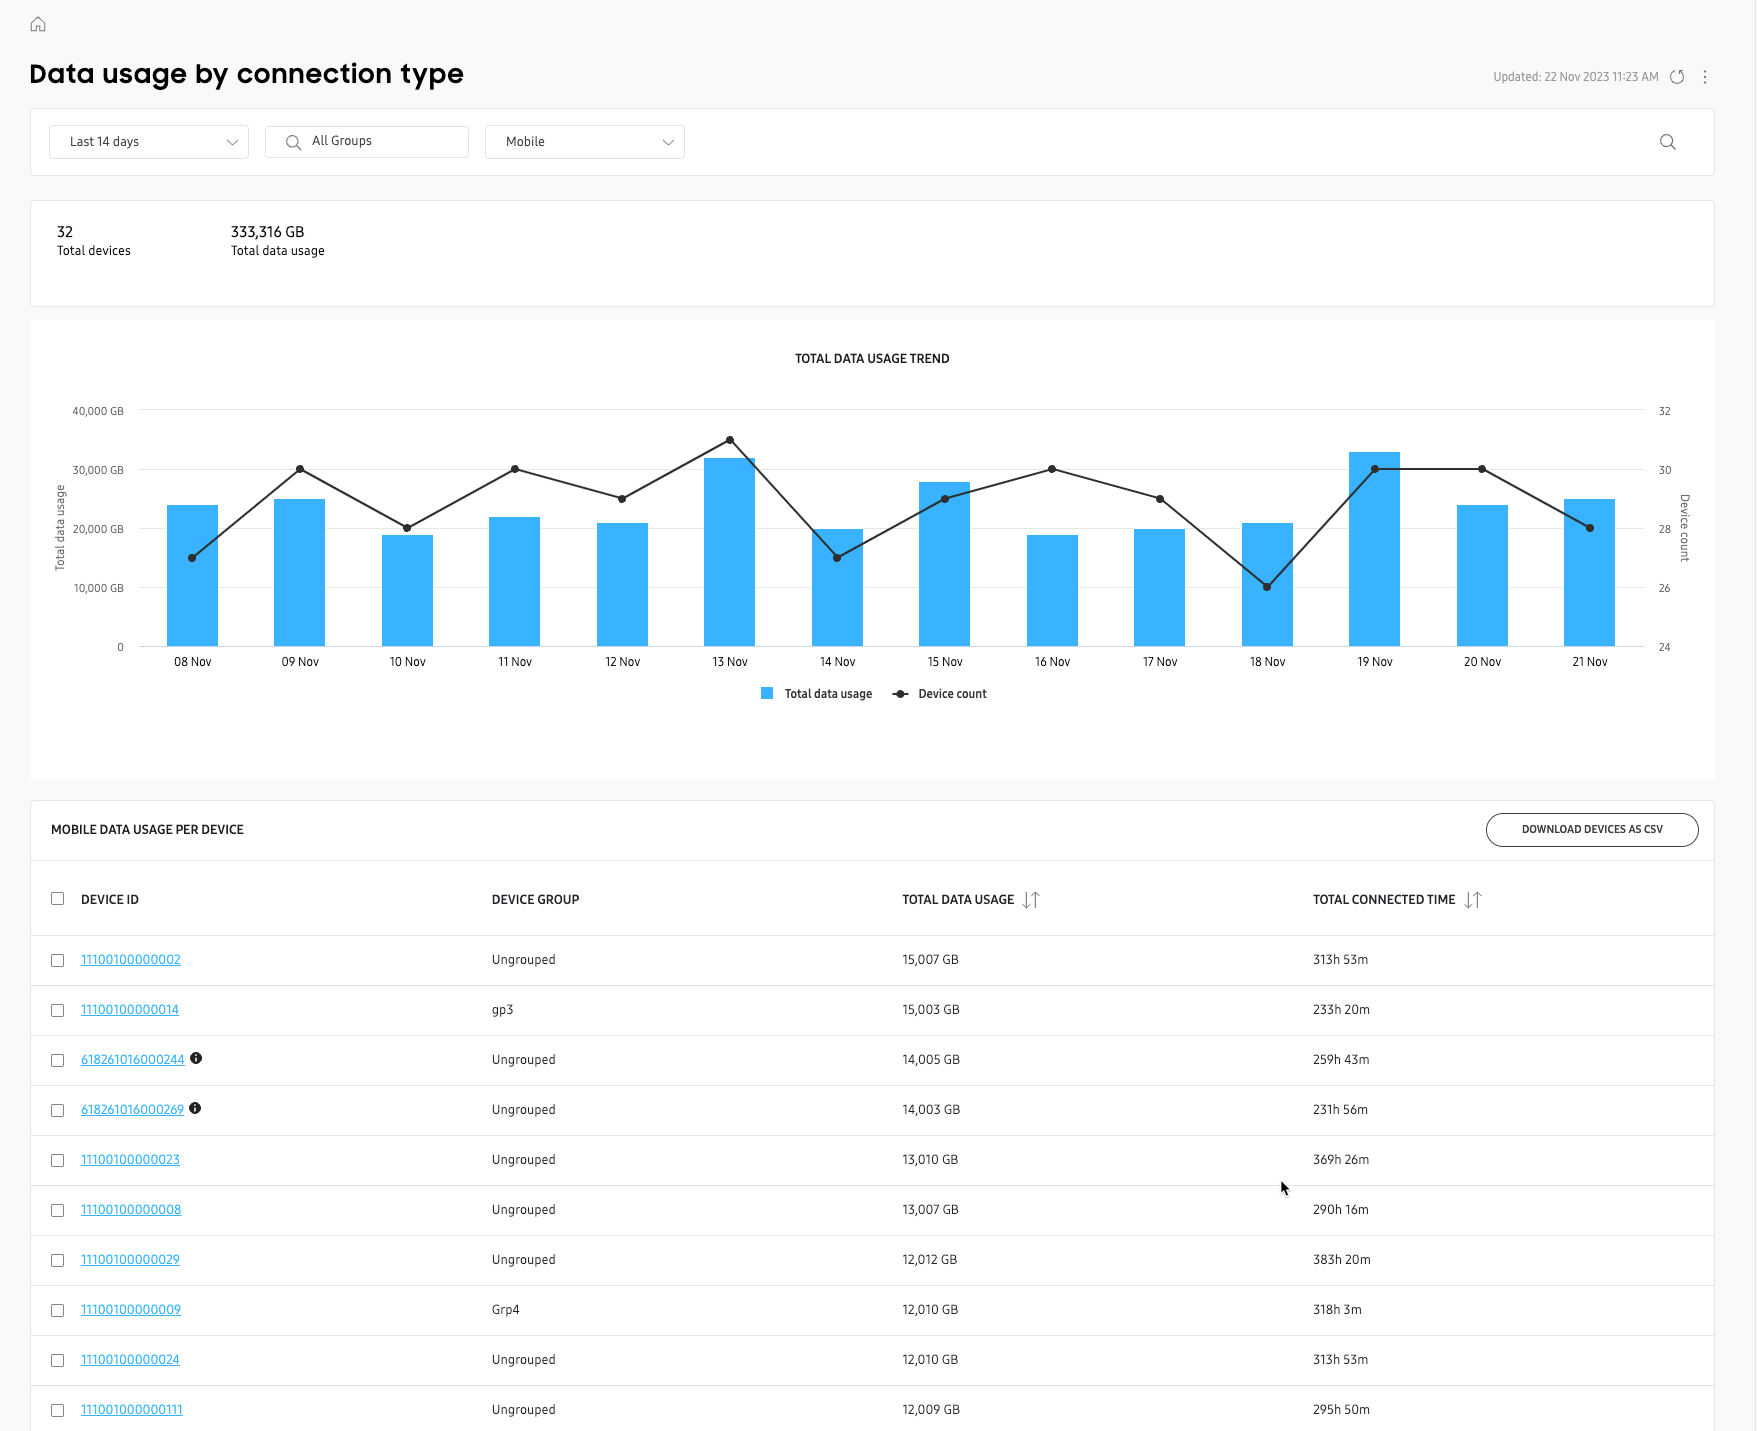
By default, the expanded details page displays mobile data only. Use the drop-down in the top ribbon to view Wi-Fi data.
Review the TOTAL DATA USAGE TREND chart to get a breakdown of how much data was used each day, and by how many devices, over the selected reporting period.
This insight doesn’t support Yesterday in the date selector. You must select Last 7 days or more in order to view this data.
In the expanded details page’s table, you can view each device’s total data consumption and connection time, and download a CSV file for further analysis. Click a DEVICE ID to view more details about a device in an expanded panel. See Manage devices for more information about the expanded device details.
On this page
Is this page helpful?