Screen time
Last updated December 6th, 2023
The Screen time insight lets you see how many hours an app was used in the foreground, and how many times it was launched by a device user, regardless of the device’s charging state.
Dashboard tile view
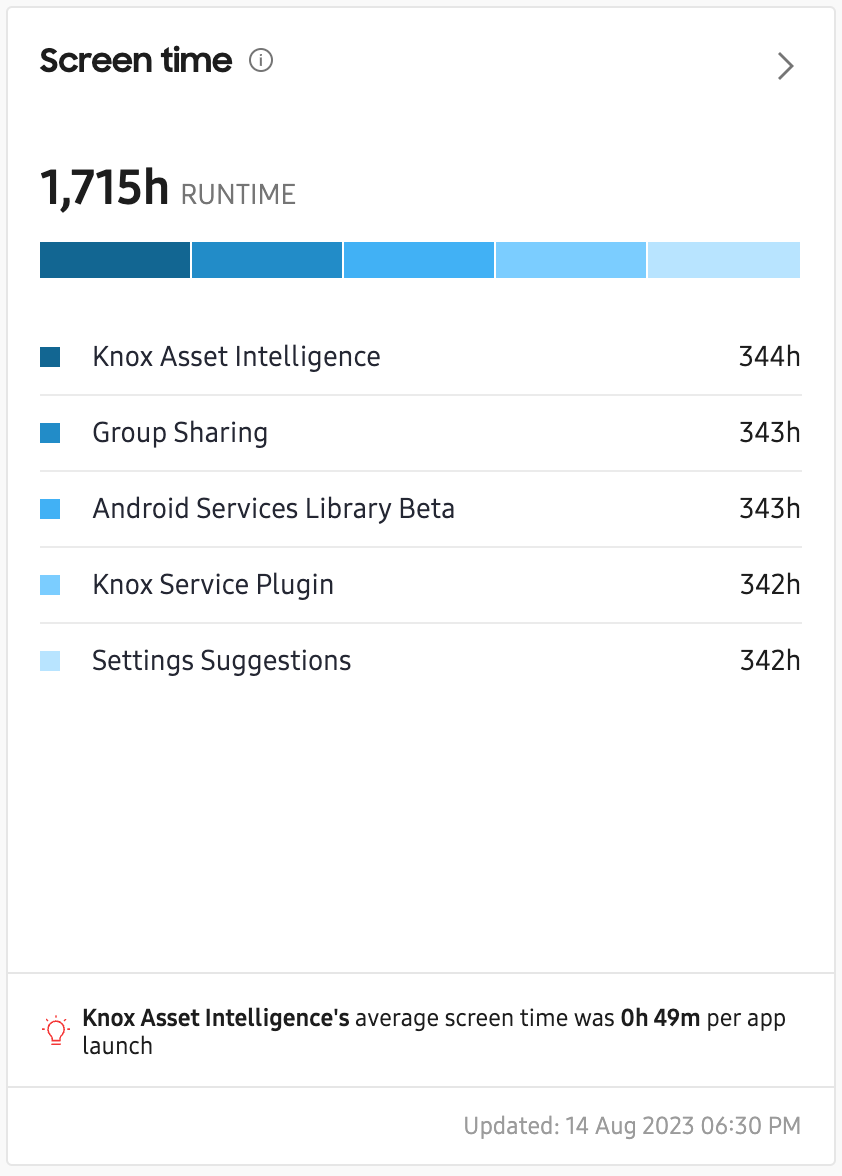
The Screen time insight’s dashboard tile view displays the top-five apps that had the most screen time in your fleet. The total combined screen time hours of the top-five apps is displayed near the top of the tile, followed by a bar-chart and data table showing each app’s name and total screen time hours over the selected reporting period.
Hover over any bar-chart segment to view an app’s total screen time, the number of times the app launched, and the total number of devices that launched the app.
At the bottom of the tile in the notification area, you’ll see the top app’s average screen time per app-launch.
Expanded details page
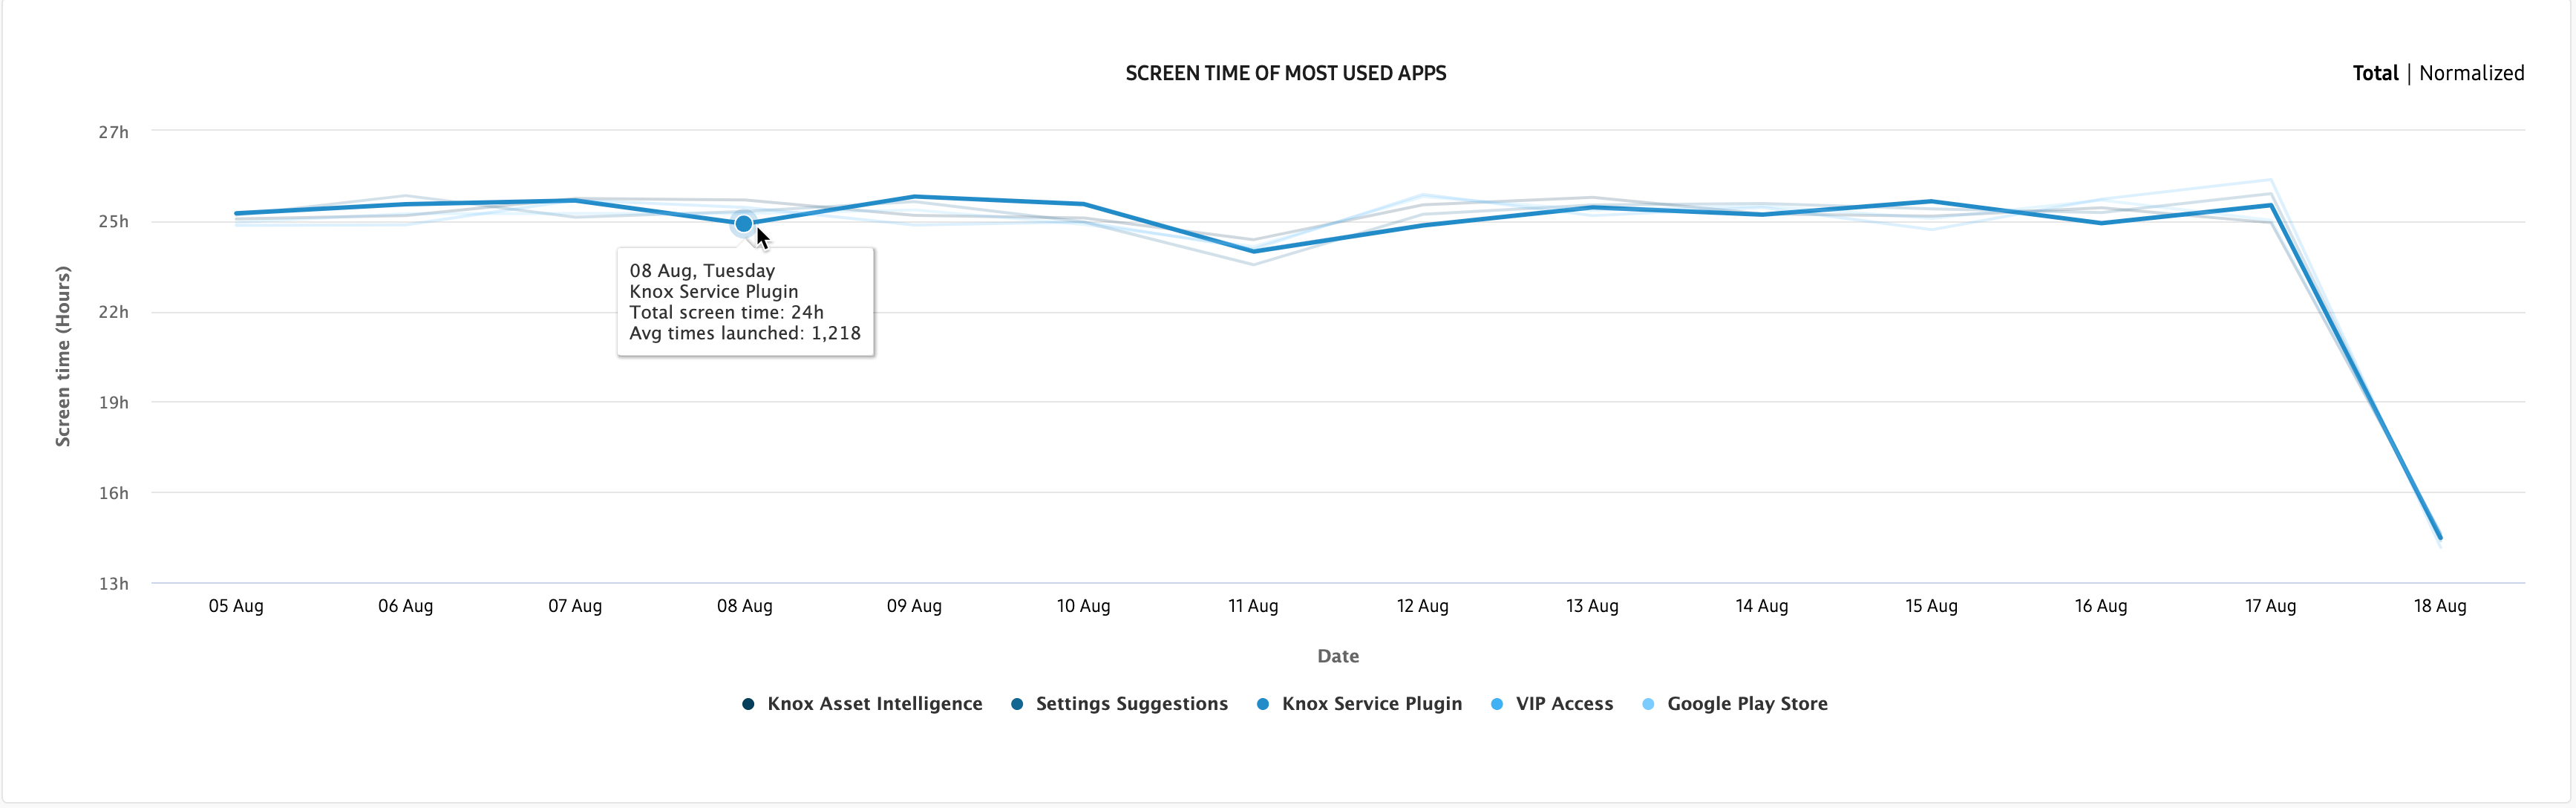
In the Screen time insight’s expanded details page, the default chart displays the total screen time hours per day for the top-five apps. Hover your mouse over the chart to view the app’s name, the total screen time hours, and the average number of times the app was launched per device on that particular day.
On the legend at the bottom of the chart, hover your mouse over any app name to focus chart on that app. Click any app name in the legend to remove it from the chart.
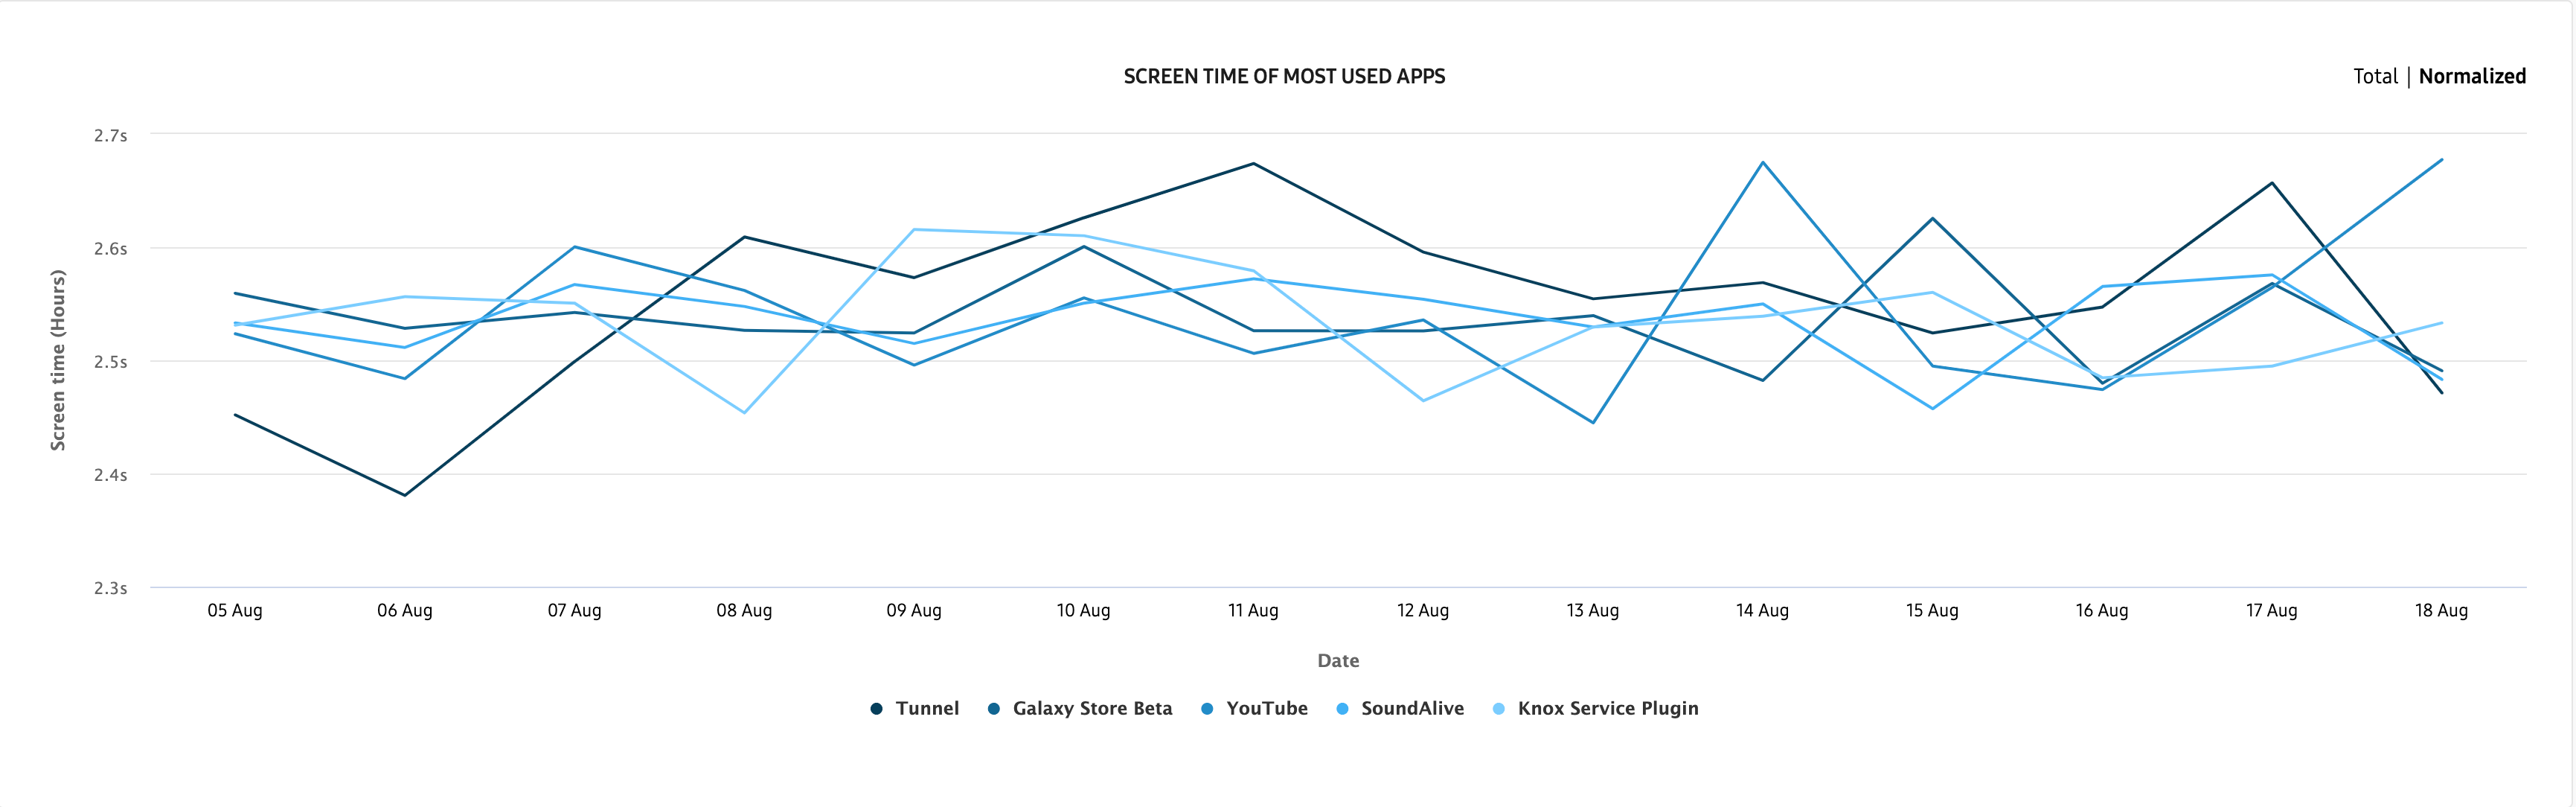
If you want to see the average screen time per app-launch, select the Normalized chart. When you hover your mouse over the chart, you’ll see the app’s name, the average screen time in seconds, and the average number of times the app was launched per device on that particular day.
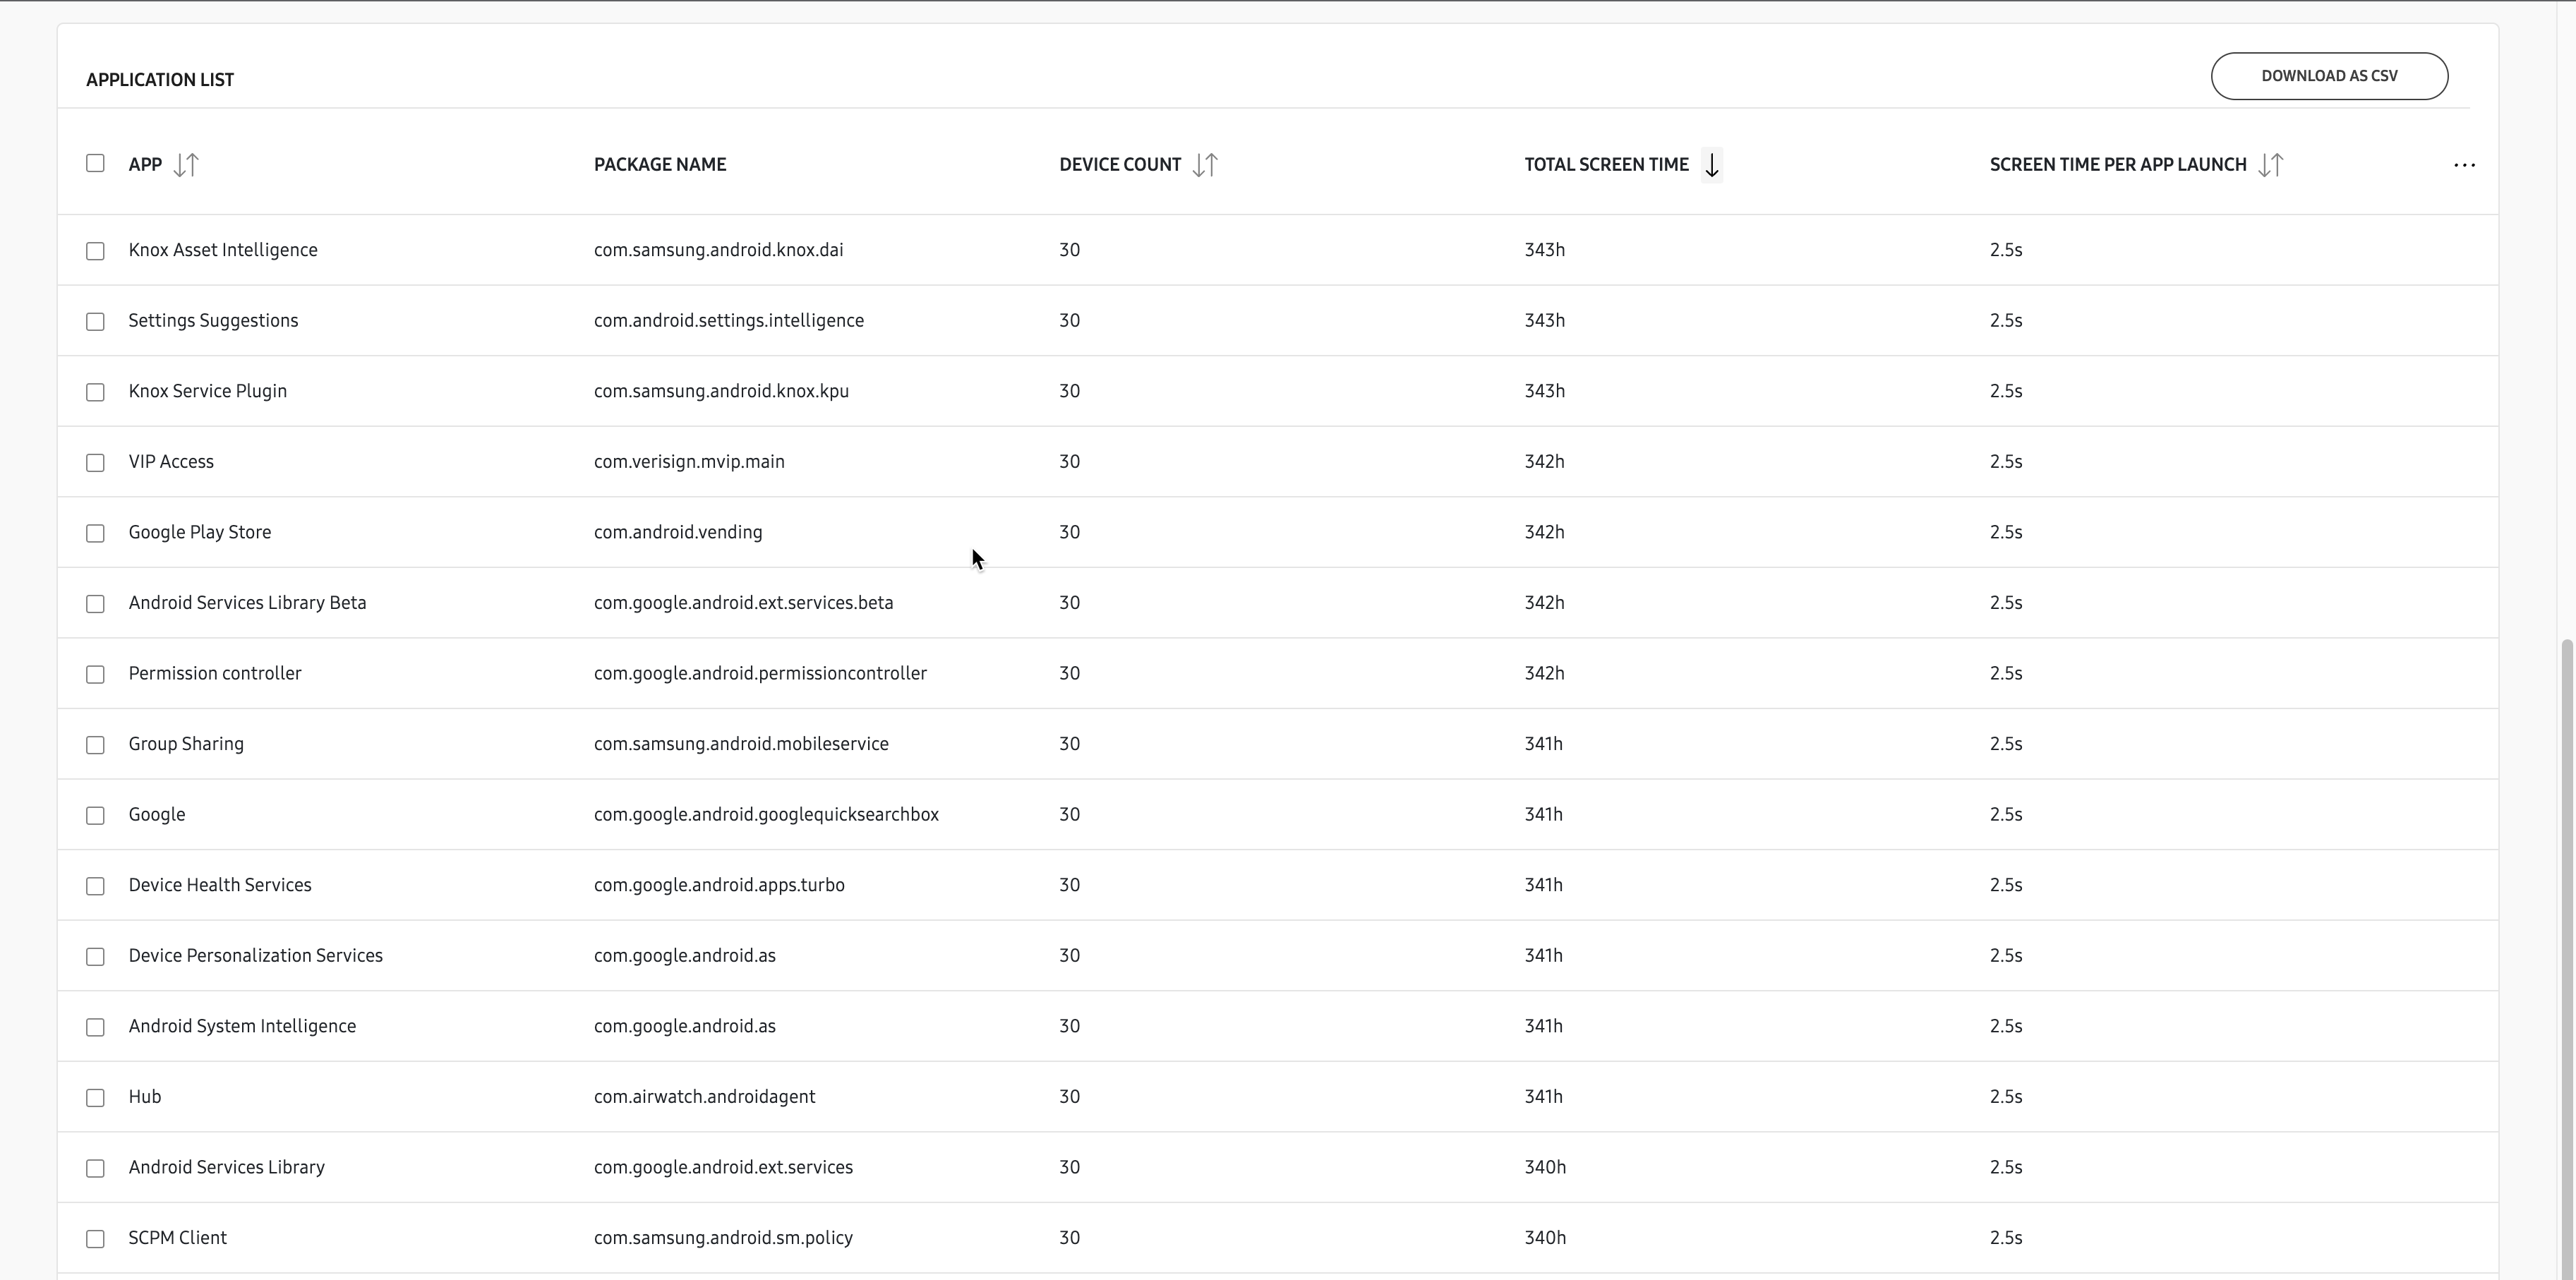
In the expanded details page data table, you can see every app that reported screen time usage over the selected reporting period. To download the table as a CSV file, click the DOWNLOAD AS CSV button in the top-right corner. To go into a drill-down page for a specific app, click the app name in the APP column.
Drill-down page
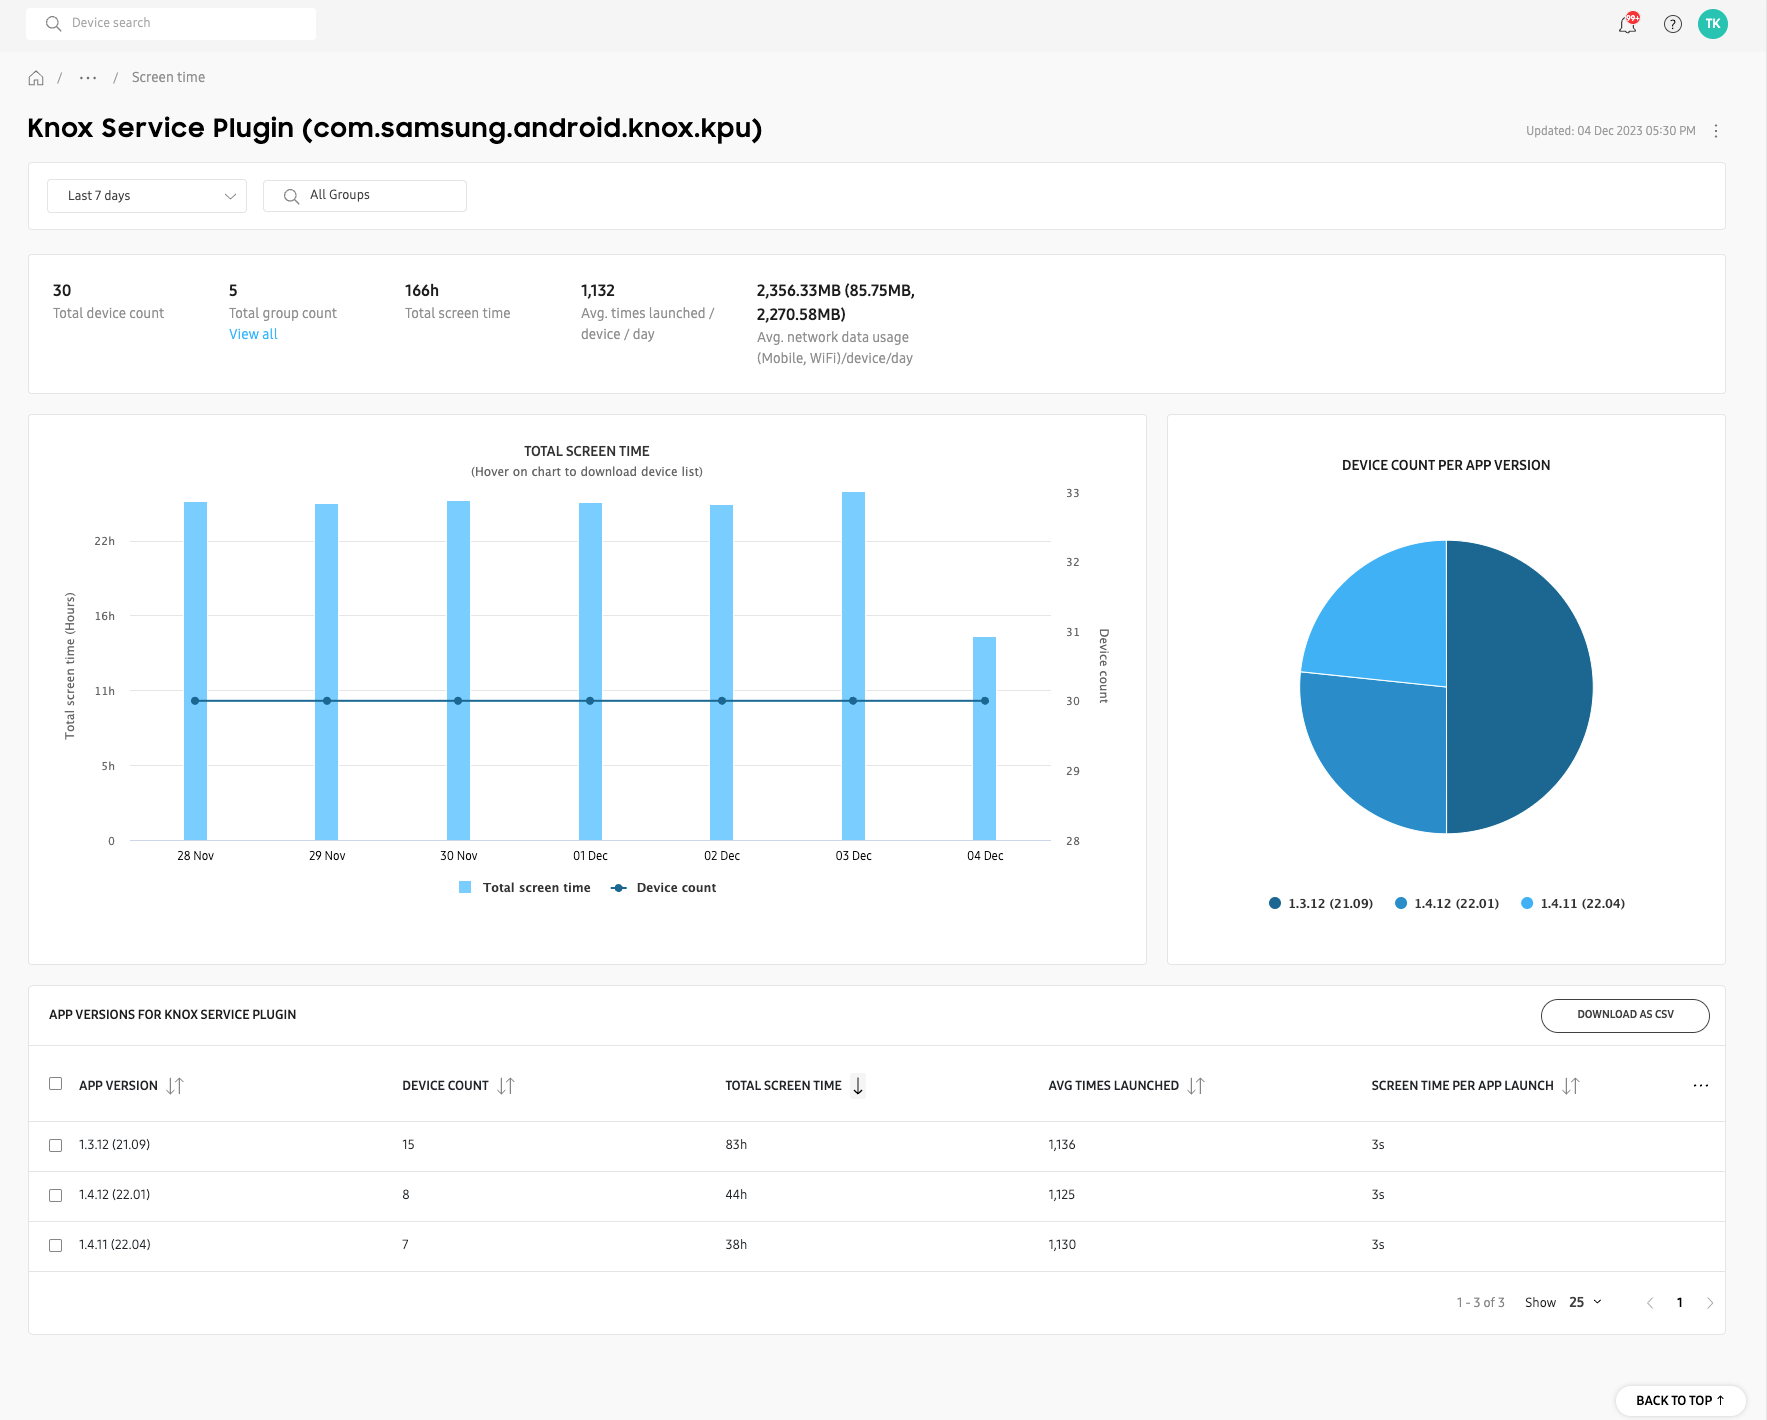
The Screen time insight’s drill-down page lets you inspect detailed screen time data for a specific app. In the top ribbon, you’ll see the total screen time across all devices in the fleet, the average number of times the app was launched per day, and the app’s average data consumption per day.
Two charts are provided in the drill-down page.
- The TOTAL SCREEN TIME chart lets you quicky see how many hours of screen time your devices had each day, based on the selected reporting period. Hover over each day in the chart to view additional information, or to download a CSV file containing the daily screen time data for each device for further analysis.
- The DEVICE COUNT PER APP VERSION chart lets you see all of the different versions of app deployed to your fleet. Hover over each section of the chart to view the total number of devices, total screen time, and average network usage per app version.
In the data table of the drill-down page, you’ll get a summary of the app’s Screen time data. Click the menu button (…) to customize the table columns. To get a CSV file of the data, click the DOWNLOAD AS CSV button in the top-right corner of the table.
On this page
Is this page helpful?