Device health
Last updated October 8th, 2026
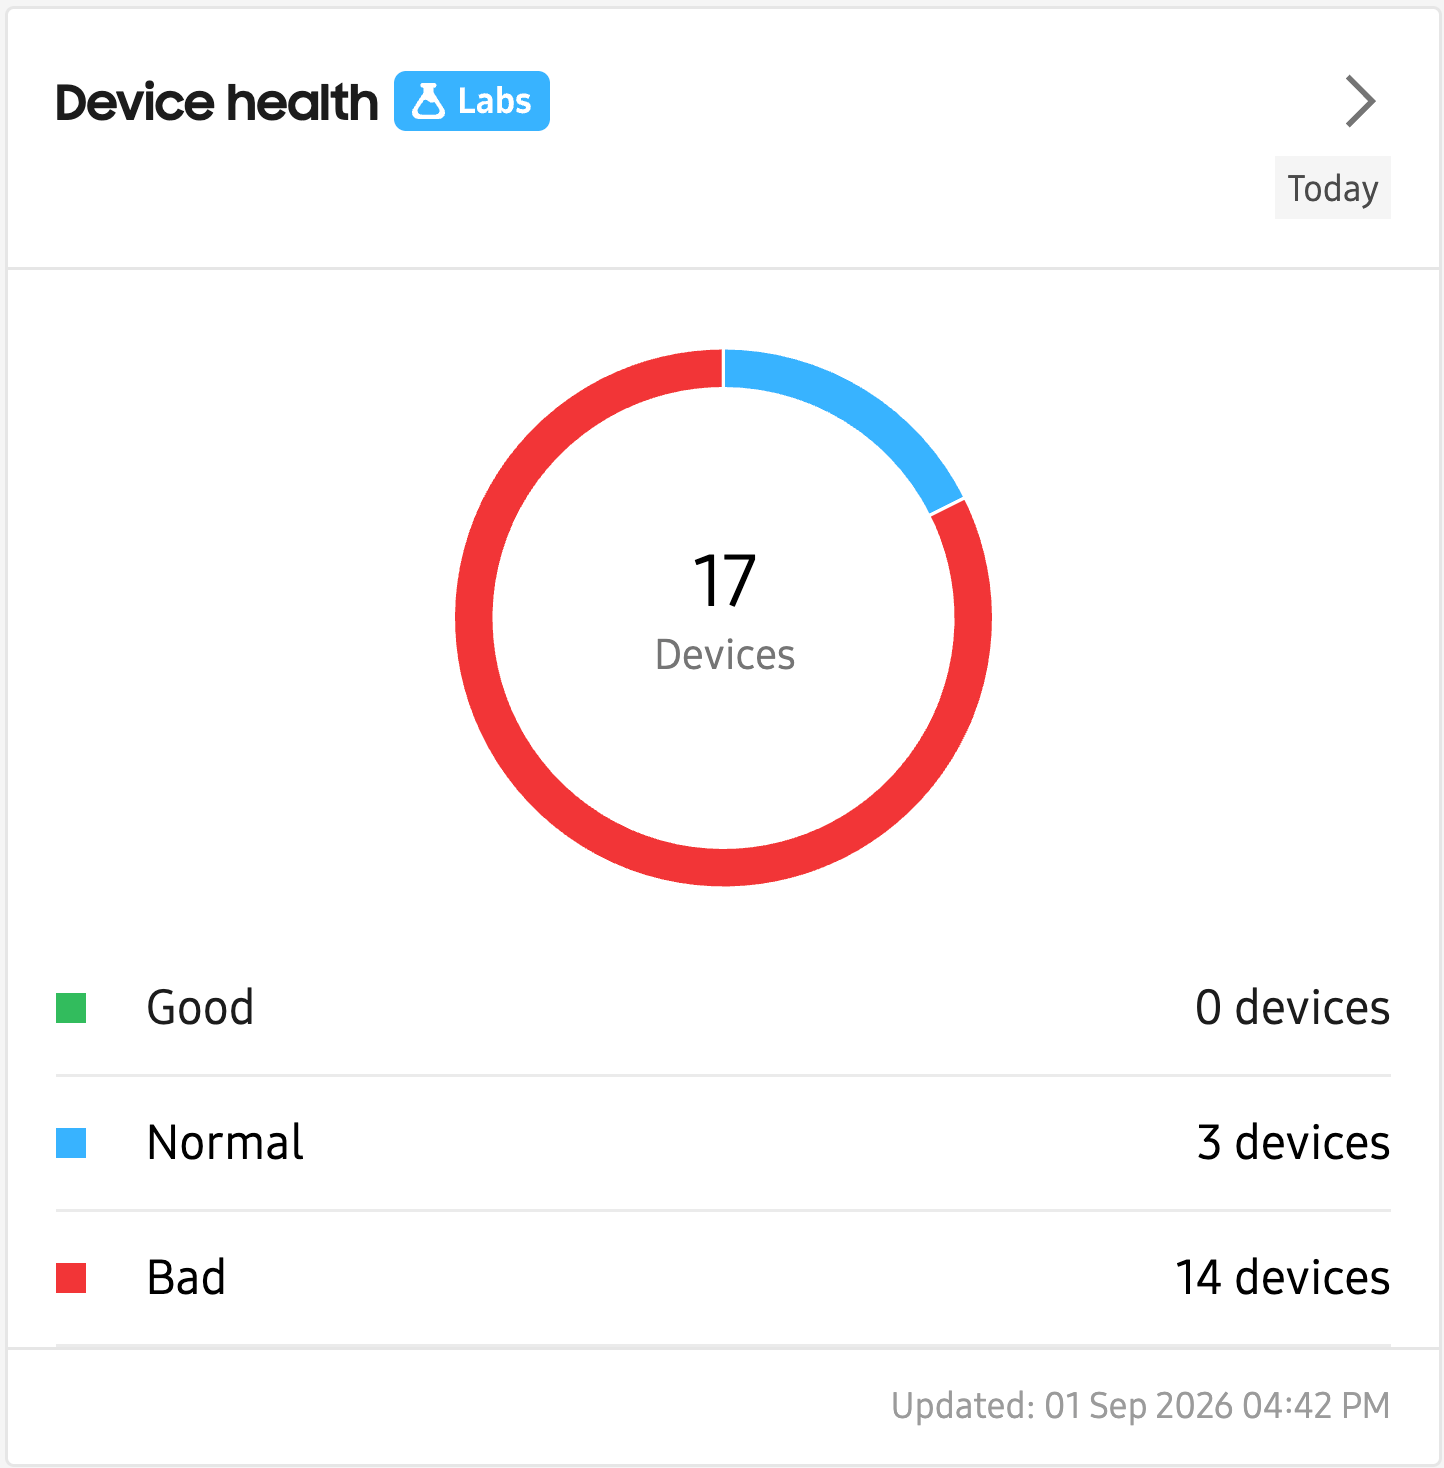
The Device health tile provides an at-a-glance view of your fleet’s overall device health, enabling quick identification of devices that may require attention or maintenance. This tile displays a ring chart showing the distribution of devices by health status. A number appears in the center of the ring chart showing the total number of devices that have reported device health data. Below the ring chart, a table displays the health status (Good, Normal, Bad) and device count per status on each row.
- Good: Device health score is 90.00 or higher
- Normal: Device health score is between 80.00 and 90.00
- Bad: Device health score is lower than 80.00
This insight does not have an expanded details or drill-down view. When you click the expand details button (>), you’re taken to the Devices page of Knox Asset Intelligence, where you can also view device health information in the device details side-panel.
How device health is calculated
Each device starts with a baseline health score of 100.00. Points are deducted from this baseline whenever the device reports events or issues that impact its performance. The following insight categories are used to calculate the device health score:
Apps
- ANR issues: The number of times an app becomes unresponsive to user input or takes too long to execute a task.
- FC issues: (Also known as a crash) The number of times an app encounters an unhandled exception or error that causes it to terminate unexpectedly, often displaying an error message to the user.
- Abnormal app events: The number of times an app reported unexpected or irregular behavior that has the potential to cause excessive battery drain.
Network
- Wi-Fi abnormal disconnect events: The number of times the device experiences an unexpected or irregular disconnection from a Wi-Fi network without a clear or valid reason.
Battery
- Battery SOH: An indicator of the battery’s ability to maintain its original charge capacity.
- Low battery events: The number of times the device battery level dropped below the allowable threshold set in Dashboard settings.
- Battery drain events: The number of times the device’s battery consumes an excessive percentage of its total capacity within an hour. The allowable drain percentage threshold is defined in Dashboard settings.
System
- CPU usage: The indicator of how much processing power the device uses to run applications or perform tasks.
- RAM usage: The indicator of how much of the device’s available memory is in use when running applications or performing tasks.
- Storage usage: The indicator of how much of its original storage space is currently consumed by the device.
Downtime
- Device turn-off time: The amount of time it takes for an Android device to completely power down after the user initiates the shutdown process.
- Network disconnection time: The amount of time it takes for an Android device to lose its network connection after the user initiates the disconnection process or when the network becomes unavailable.
- Recharging time with screen off: The amount of time it takes for an Android device to fully recharge its battery when the screen is turned off.
On this page
Is this page helpful?