Apps with highest RAM usage
Last updated April 9th, 2025
The Apps with highest RAM usage insight lets you see which apps in your fleet have the highest RAM consumption. You can use this information to determine if certain apps are problematic, and make adjustments to optimize your fleet’s device performance and productivity.
Dashboard tile
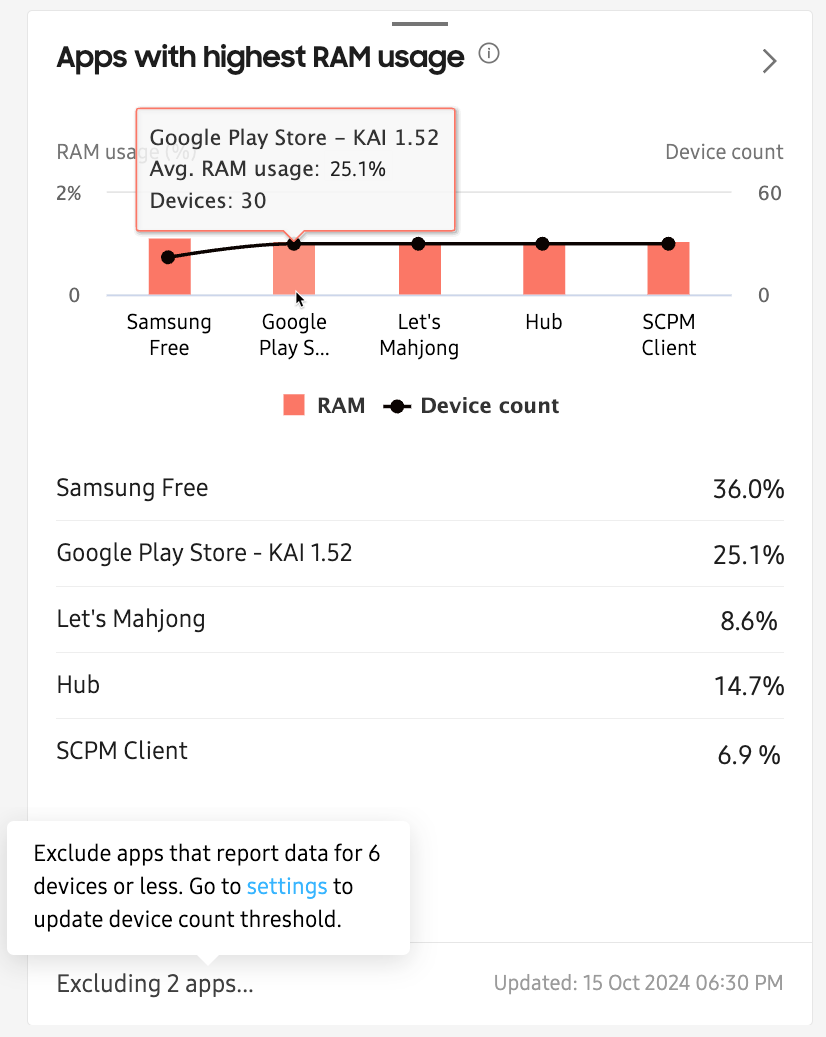
This insight’s dashboard tile view displays the top five apps with the highest RAM usage over a selected reporting period.
Chart
The dashboard tile chart displays RAM usage information for the top five most used apps in your fleet. Hover each segment of the chart to view the full app name, total number of devices that used the app, and the average RAM usage % per device per day.
Table
The table lists highest average RAM usage for the same top five apps. Click any app in this list to see its RAM usage details on a drill-down page.
Notification area
In the tile’s notification section, you’ll see the number of apps that were excluded from the insight’s calculations.
For example, if the notification section displays Excluding 2 apps, this means that RAM usage data was reported by 2 different apps, but these apps did not meet the device reporting threshold set in Dashboard Settings > Thresholds.

When you hover over a notification, you’ll see the following message (where N represents the device reporting threshold value):
Exclude apps that report data for N devices or less. Go to settings to update device count threshold.
For example, if your threshold value was set to exclude apps for 6 devices or less, this means that at least 7 (or more) devices must report RAM usage data from the same app. If 6 (or fewer) devices reported RAM usage from the same app, then this usage data is captured in the system, but excluded from any charts or tables.
In the example above, this insight reported that 2 apps recorded RAM usage data, but there weren’t enough devices using those apps (according to the threshold value) during the reporting period. Therefore, the apps were excluded from the insight.
Expanded details page
The expanded details page of Apps with highest RAM usage displays every app that reported high RAM usage over a selected reporting period, excluding any apps that didn’t meet the device reporting threshold.
Summary
In the summary row, you can see the total number of apps that reported high RAM usage. This number corresponds with the data shown in the table, where you’ll see each reported app, along with information such as the package name, average RAM usage, and device count, to help you analyze and troubleshoot issues further.
Chart
The expanded details page chart doesn’t support the Today and Yesterday reporting periods.
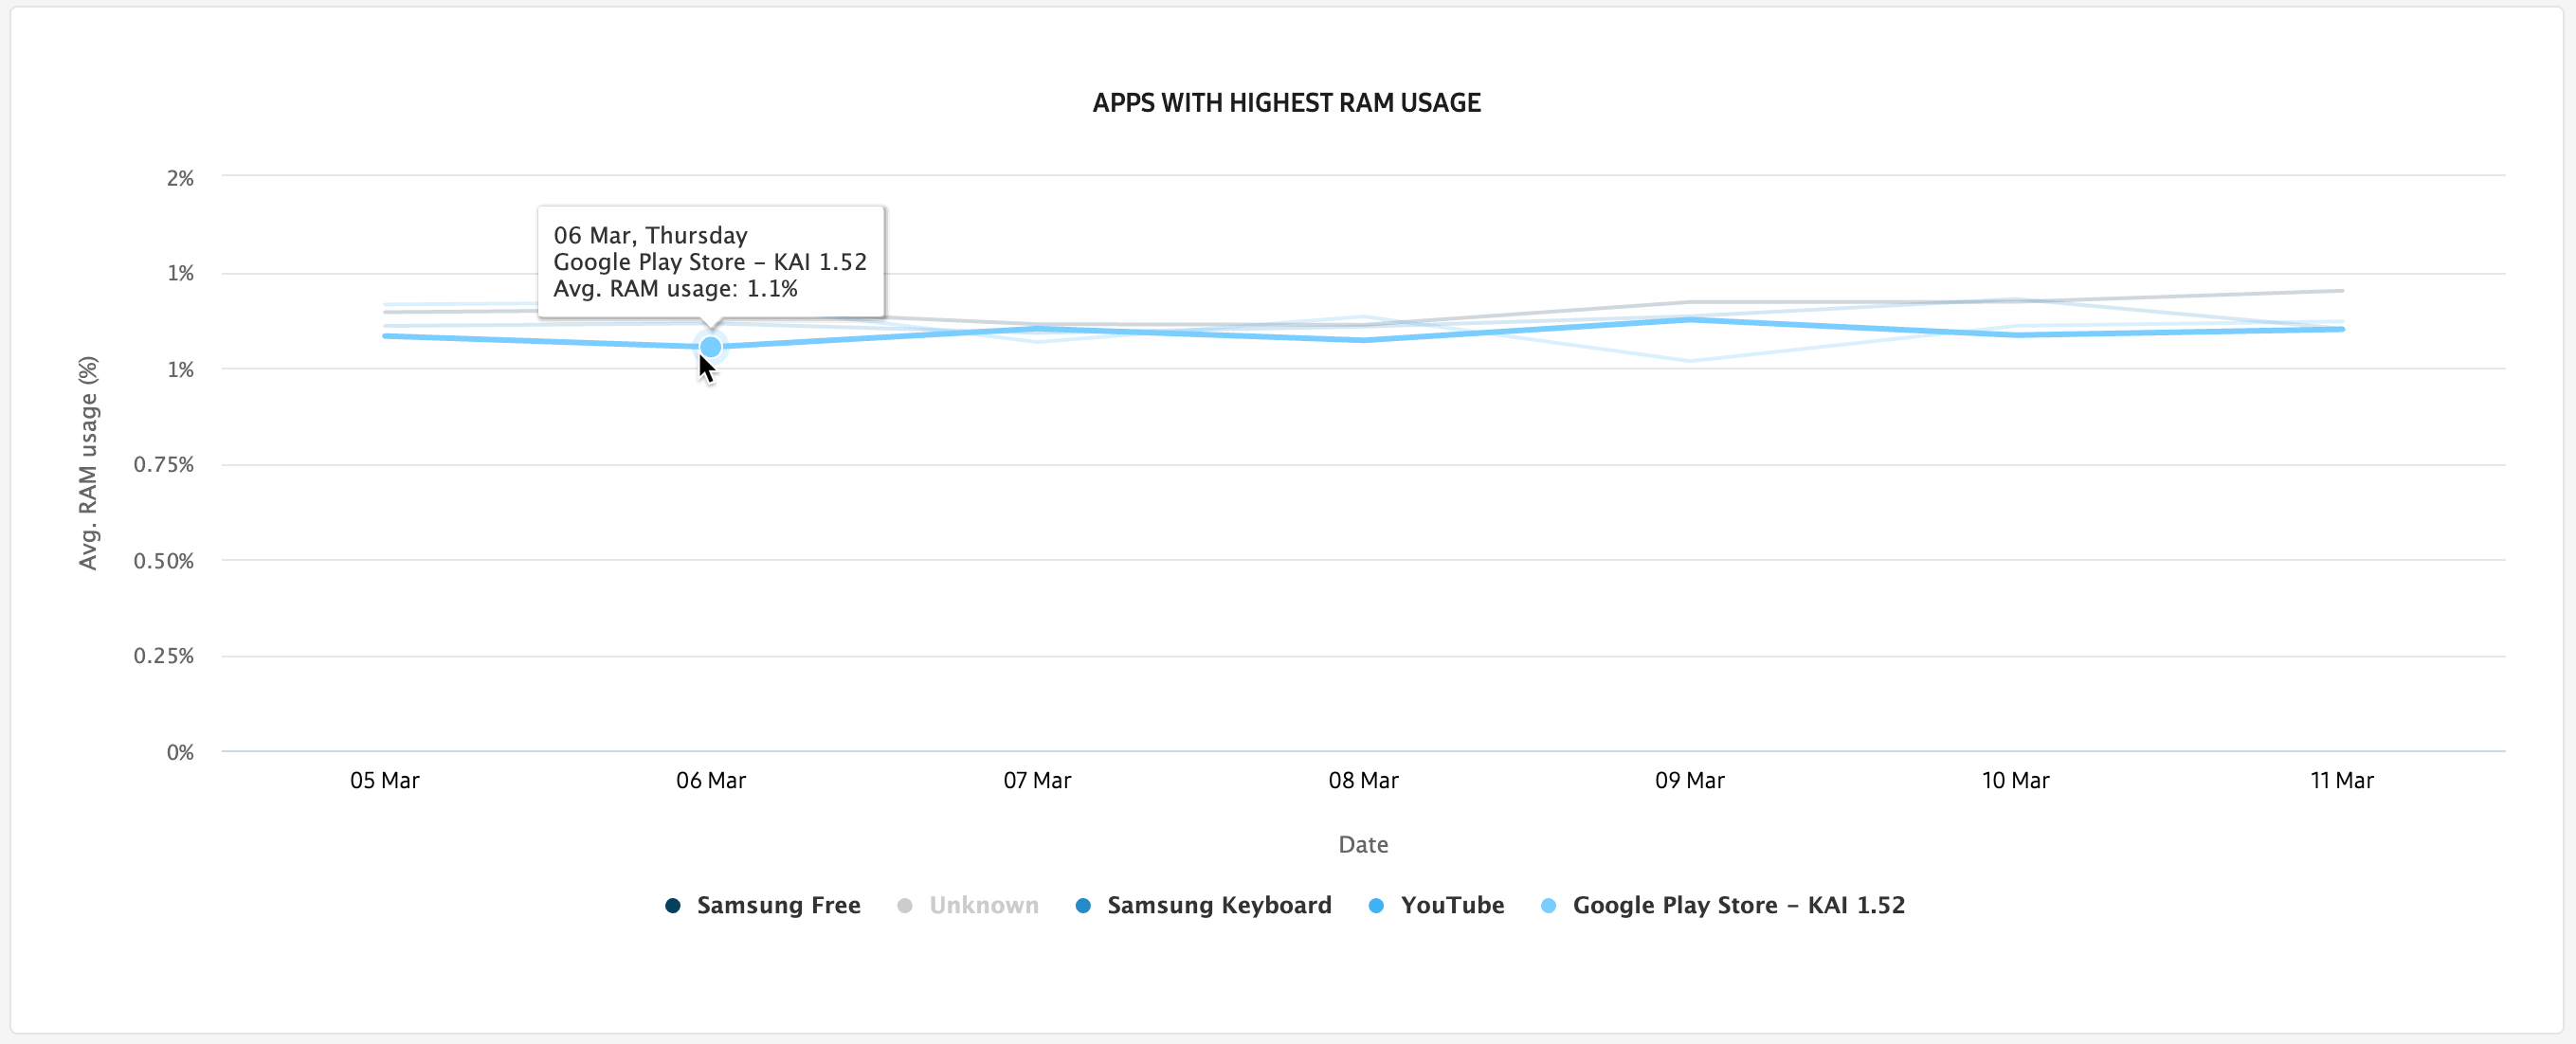
The APPS WITH HIGHEST RAM USAGE chart shows the top five apps with the highest RAM usage in the fleet. You can hover over any segment of the chart to view details like the app name and average RAM usage %, or click an app name in the legend to hide or remove the app from the chart.
Table
The expanded details page chart doesn’t support the Today reporting period.
The APPLICATION LIST displays every app in your fleet that reported RAM usage data. By default, the App and Avg. RAM usage columns are always displayed. Click CUSTOMIZE TABLE (…) to add, remove, or change the columns in the table.
To help you analyze your data offline, you can click DOWNLOAD AS CSV to get a copy of the table sent to your email, or click CREATE APP USAGE REPORT to build a custom report based on your data requirements.
Drill-down page
The drill-down page doesn’t support the Today reporting period.
The drill-down page provides a detailed analysis of the RAM usage data for a specific app, over the selected reporting period.
You can access this page by clicking any app in the expanded details page table, or clicking any of the top five apps listed on the dashboard tile.
Summary
In the summary ribbon at the top of the page, you’ll see the total number of devices that ran the app, as well as the average RAM usage percentage, average battery usage, and total app run time over a selected reporting period.
Chart
This drill-down page displays two charts.
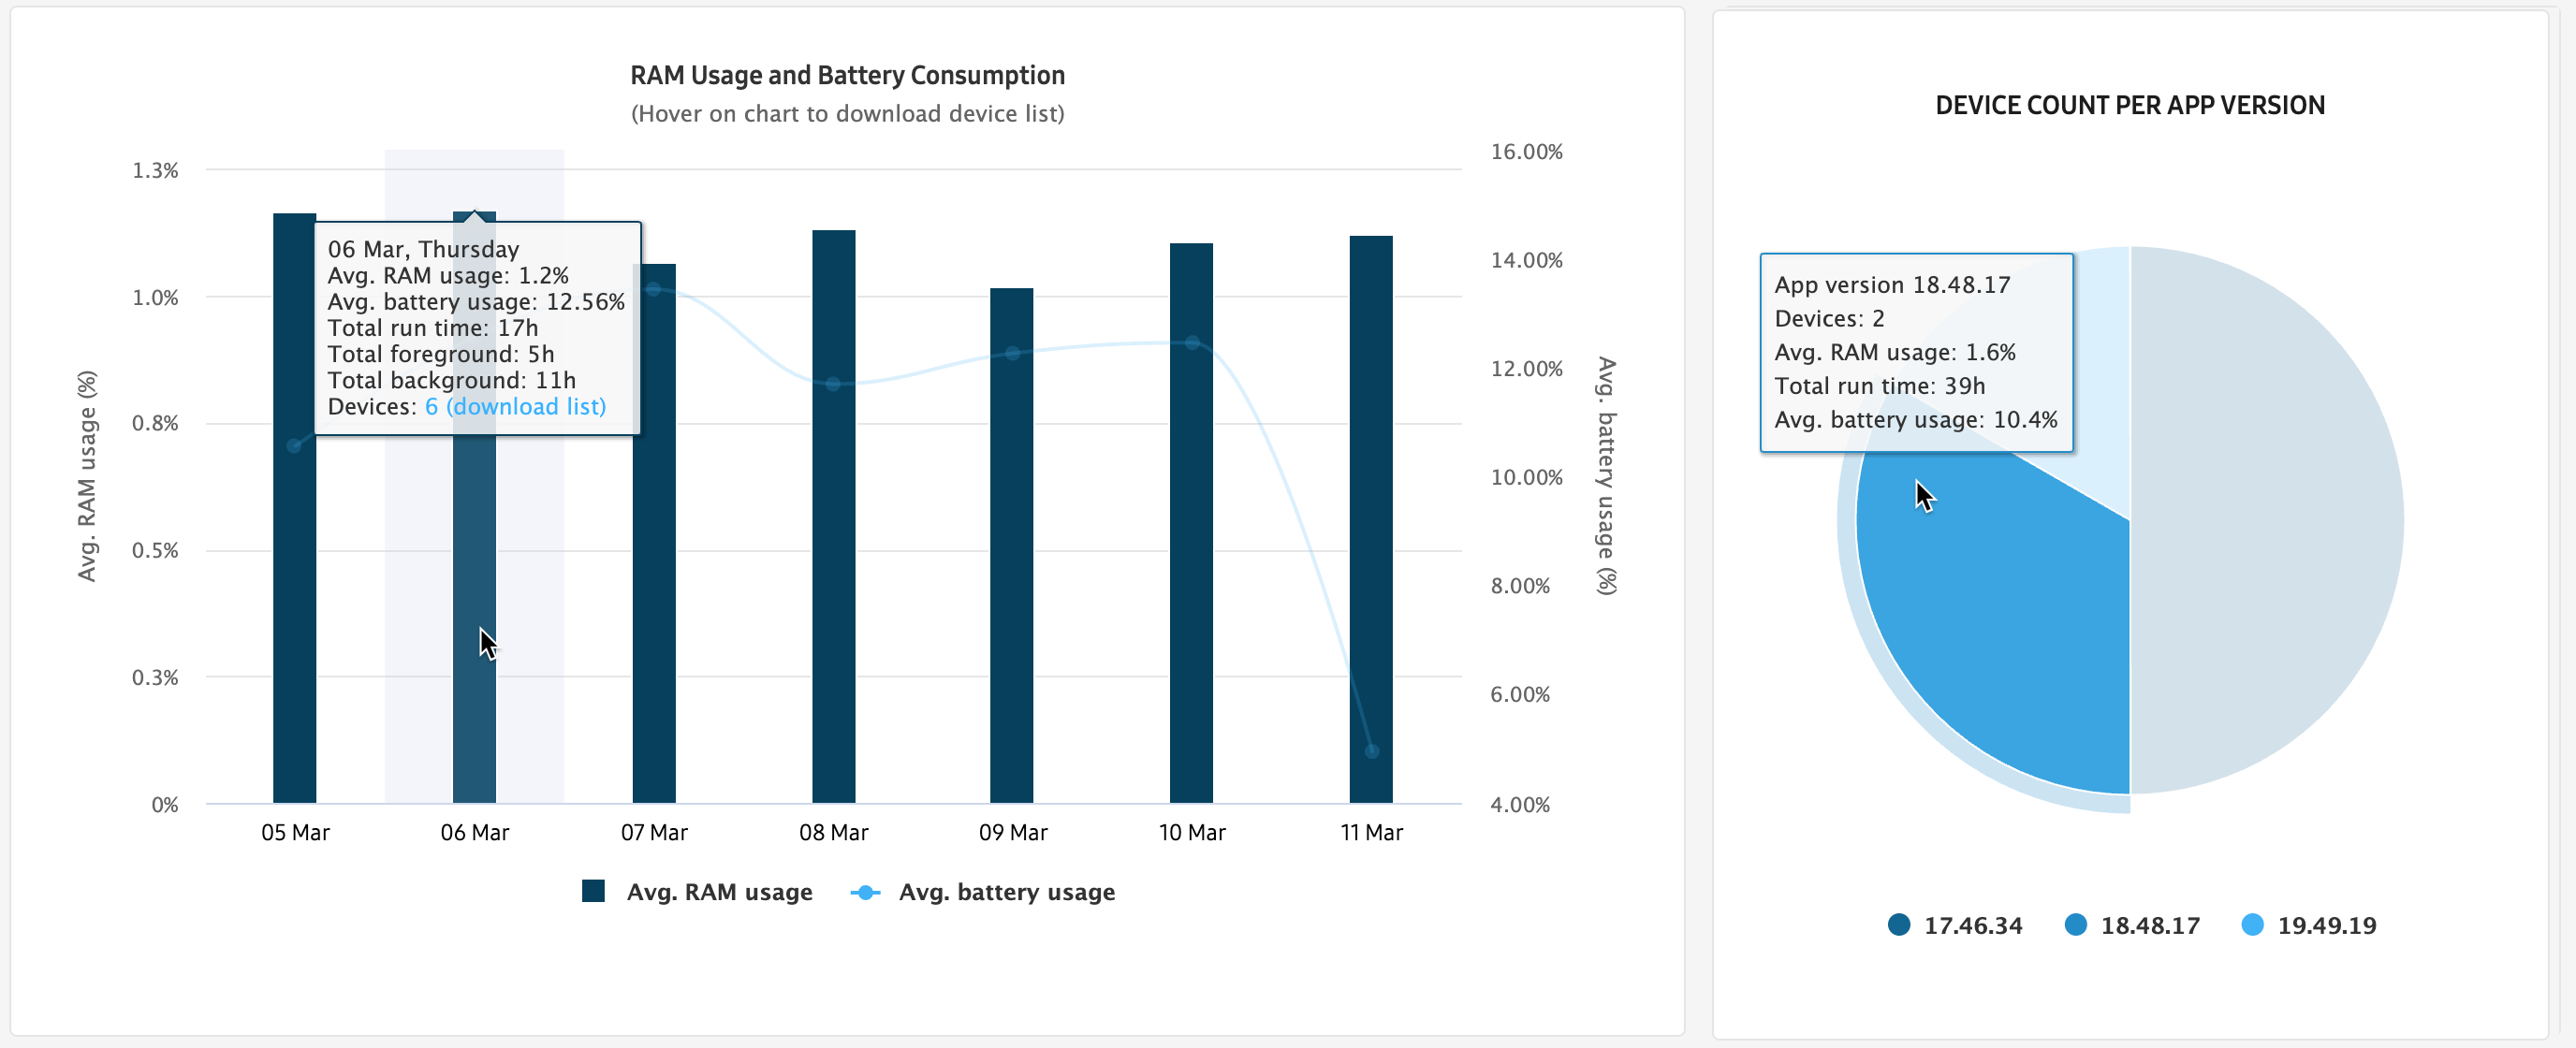
- On the RAM Usage and Battery Consumption chart, you’ll see a breakdown of that app’s average RAM and battery usage. Hover over a chart segment to view additional app usage details like total, foreground, and background run time, and download a usage report for all devices that used the app.
- On the DEVICE COUNT PER APP VERSION chart, you’ll see a breakdown of the different app versions deployed in your fleet. Hover over each segment of the chart to view the total number of devices, as well as the run time, average battery, and average RAM usage for that version of the app.
The RAM Usage and Battery Consumption chart does not show data when Today or Yesterday is selected as the reporting period.
Table
By default, the App version, Avg. RAM usage, and Avg. battery consumption columns are always displayed. Click CUSTOMIZE TABLE (…) to add, remove, or change the columns in the table.
To help you analyze your data offline, you can click the DOWNLOAD AS CSV button to get a copy of the table sent to your email.
On this page
Is this page helpful?